Goodygoody Girdwood Chronology Construction

 Guest bloggers: Kaitlin Starr and Maddie Happ
BLOG4

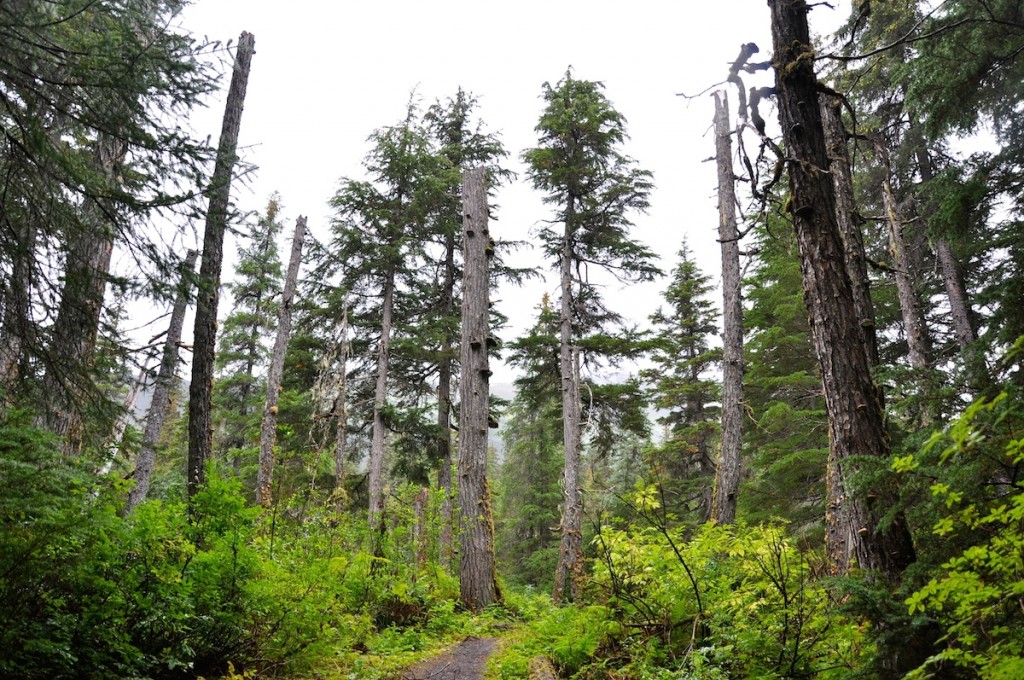
Forest surrounding Girdwood, Alaska. Living mountain hemlock trees were cored from this site (Wiles, 2014).

    During the summer of 2014, the Columbia Bay team (Dr.Wiles, Nick Wiesenberg, Kaitlin Starr and Jesse Wiles) cored numerous trees near the town of Girdwood, Alaska. The collection is primarily made up of cores taken from living Mountain Hemlock trees from the surrounding forest. In addition to the living forests a few cores were taken from subfossil wood at Turnagain Arm.
DSC_0064

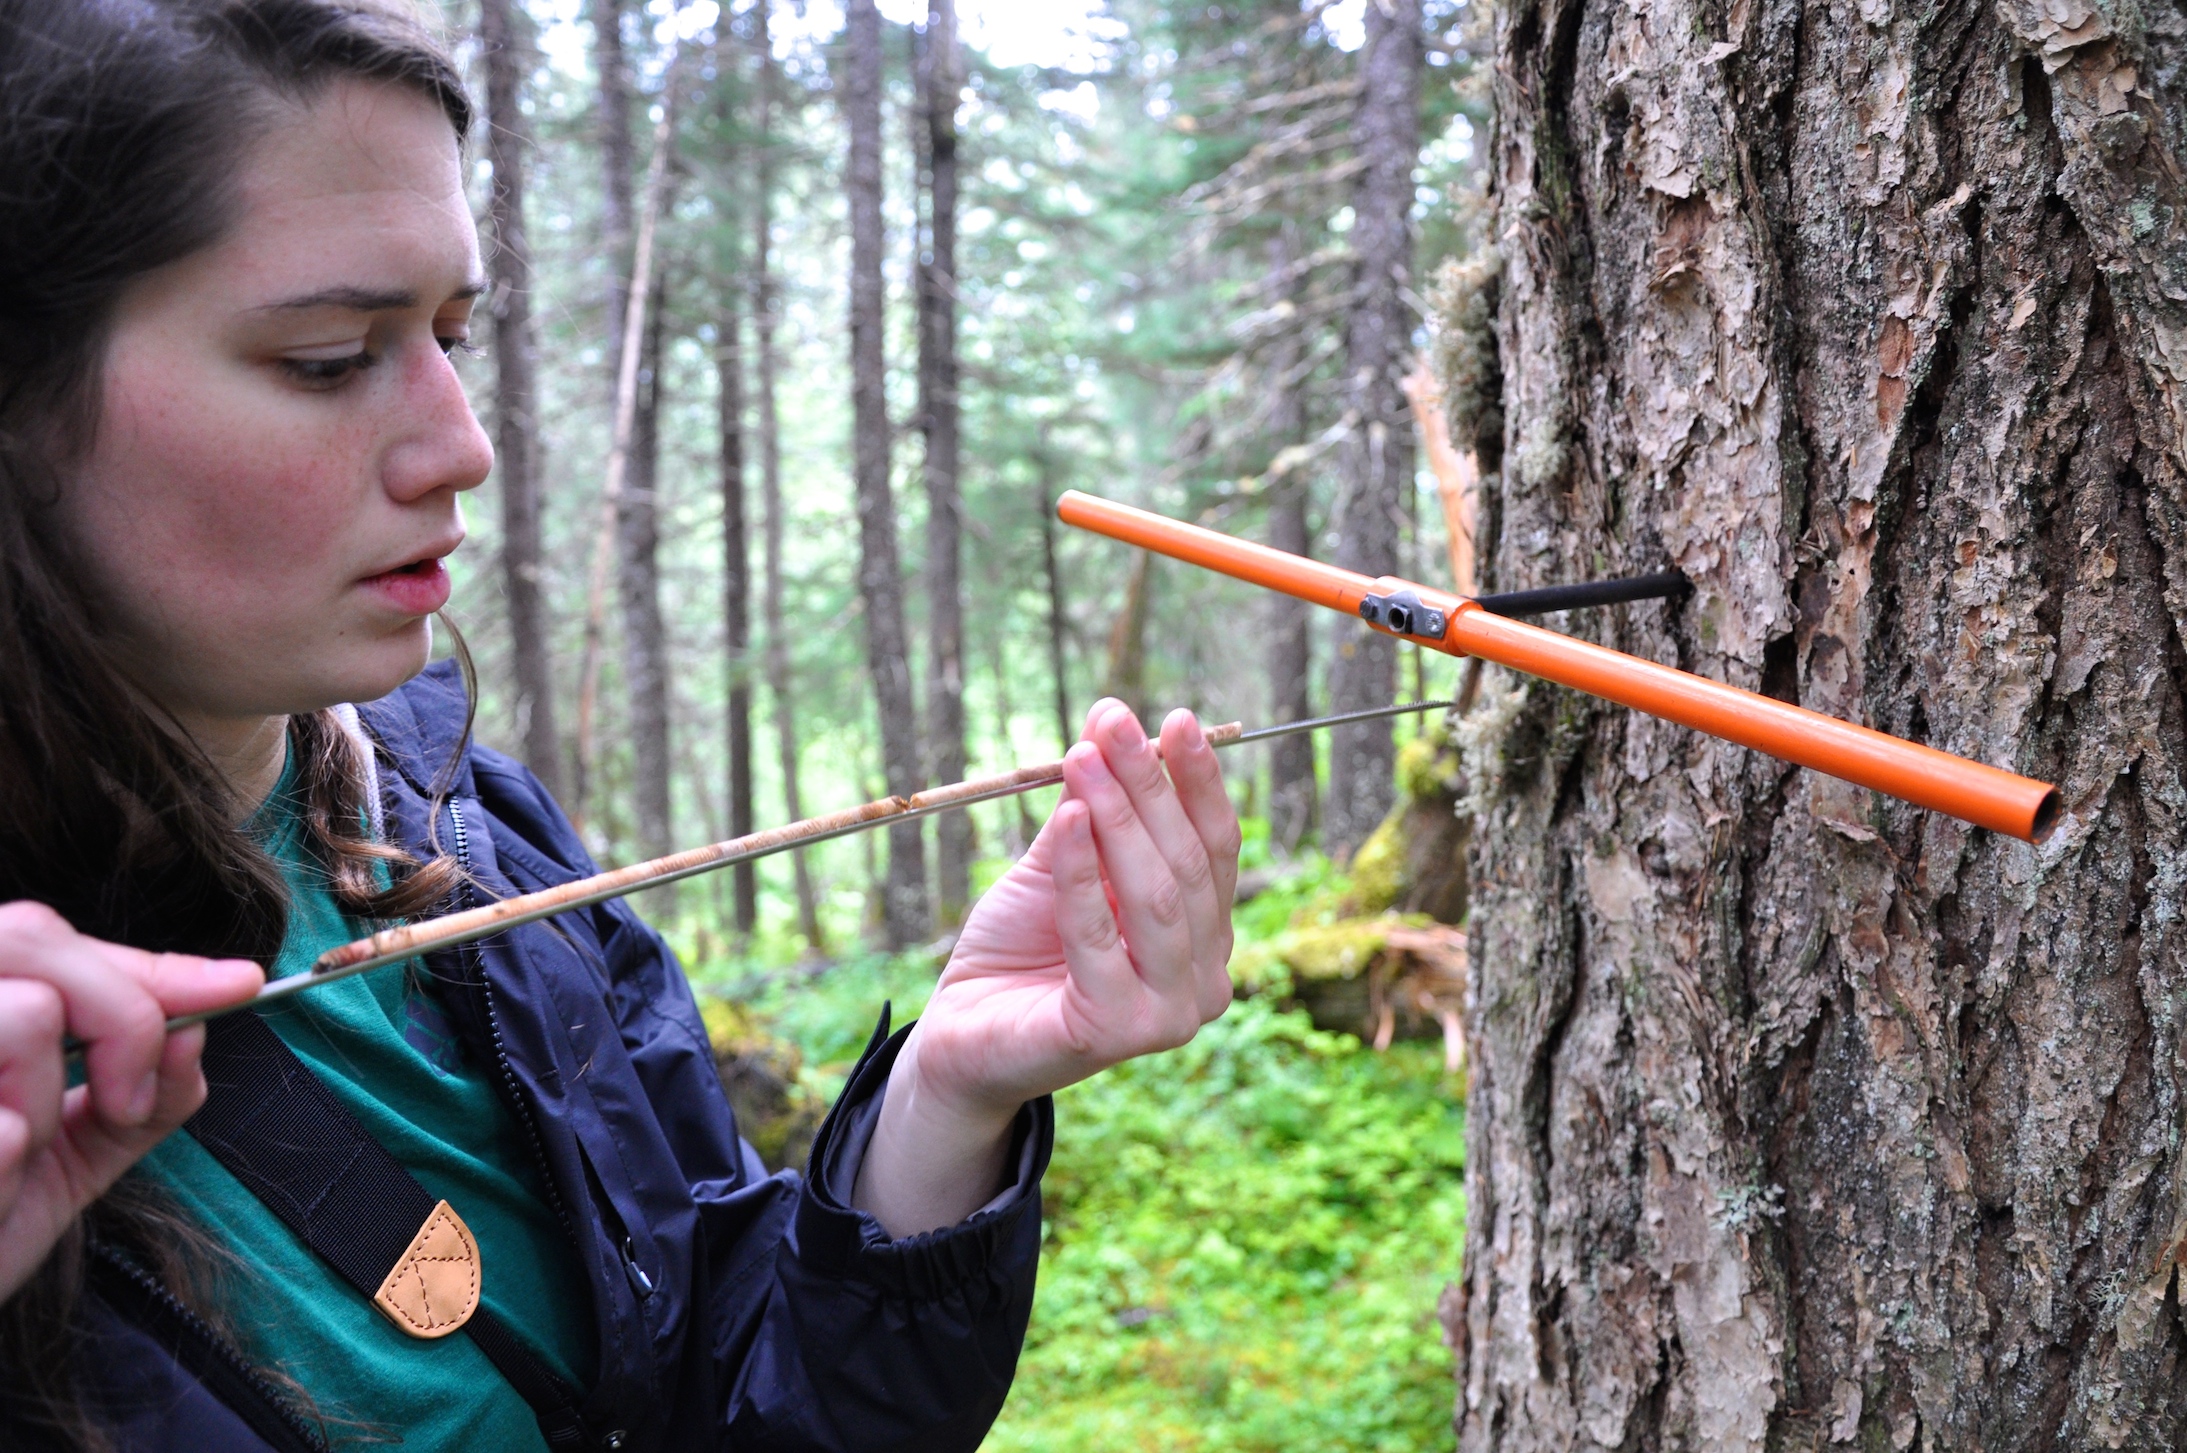
Kaitlin Starr coring a living Western Hemlock found in the forests surrounding the town of Girdwood (Starr, 2014).

    The Girdwood living tree collection was brought back to the Wooster Tree Ring Lab where the cores were mounted, sanded, counted and measured. Students, Maddie Happ and Kaitlin Starr constructed a chronology out of 38 cores sampled. The chronology spans 342 years, beginning at 1672 and extending to 2014. When compared to the established Turnagain Pass chronology by Jacoby, G.C., D’Arrigo, R.D., Buckley, B., our new Girdwood chronology correlated well. In addition, our chronology extends the known database for the region by contributing an additional 85 years of data.
Blog2

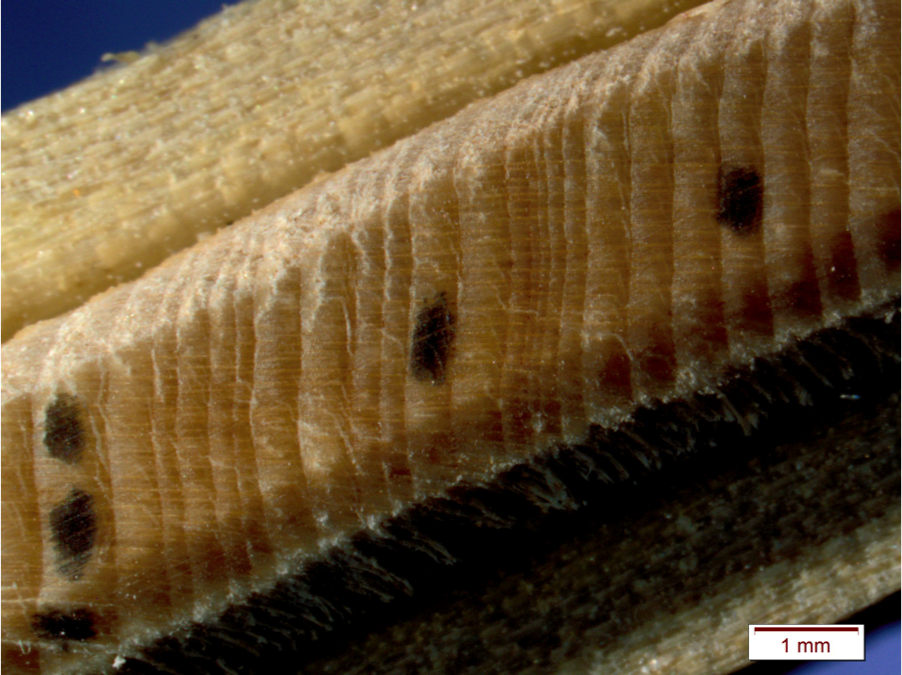
Girdwood core sample illustrating both tight and normal growth patterns. Growth patterns may vary due to shifting climates. Tight growth often occurs during periods of distress, such as drought or storms.

    The graph below illustrates the standardized tree ring measurements by removing biological growth trends from   the series. Removing growth trends allows us to view the desired climate signal.
Blog4

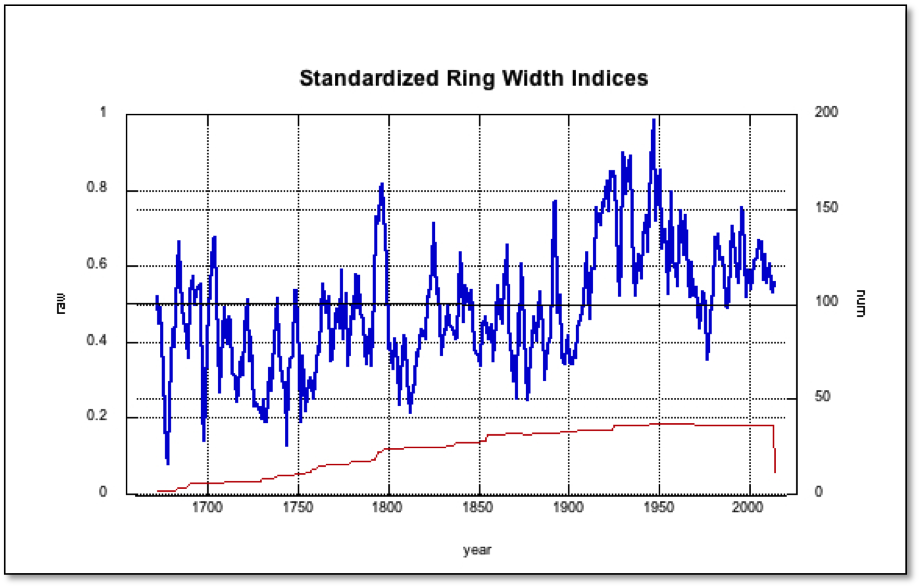
Standardized Girdwood chronology note the upward trend in the series . The red line indicates the sample size.

The chronology was compared with meteorological data from the nearest station, Anchorage (International Airport) and correlations are plotted below. We found an unexpected high negative correlation between our chronology and the minimum temperature data, specifically throughout the summer months (June, July and August). The possible cause of this correlation is unknown at the moment.

Screen Shot 2015-06-12 at 11.21.19 AM

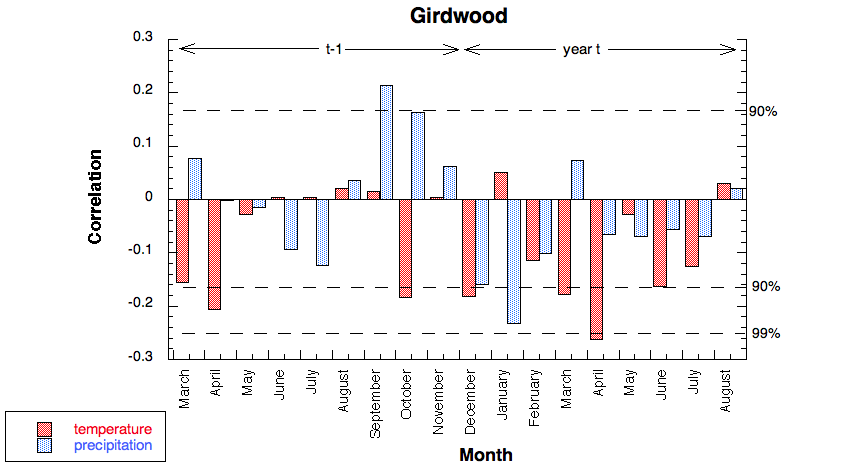
This graph illustrates the overall correlation between tree ring width and mean temperature and precipitation in Girdwood, Alaska for the dendroclimatic year.

Screen Shot 2015-06-12 at 11.21.43 AM

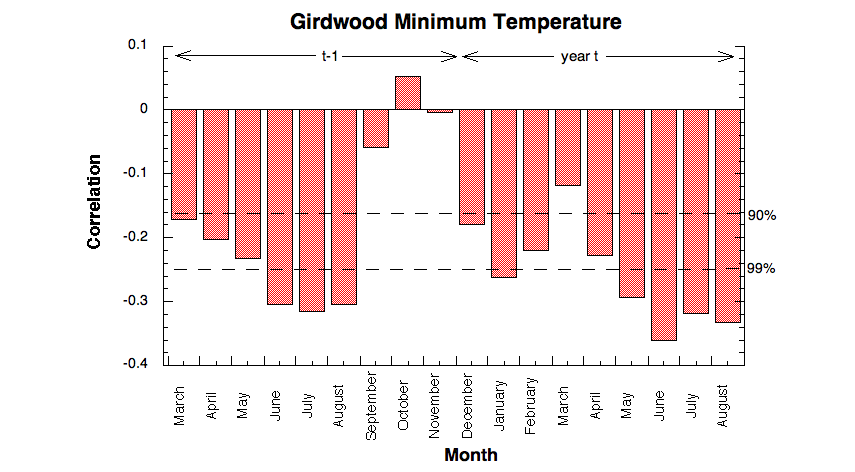
The above graph displays the overall minimum temperature compared to the tree ring widths for Girdwood, Alaska. A clear significant negative correlation exists for the months of May, June, July, and August.


This entry was posted in Uncategorized. Bookmark the permalink.

1 Response to Goodygoody Girdwood Chronology Construction

  1. Mark Wilson says:

    Nice story, Maddie and Kaitlin!

Leave a Reply

Your email address will not be published. Required fields are marked *

This site uses Akismet to reduce spam. Learn how your comment data is processed.