


Advised by: Dr. Wiles
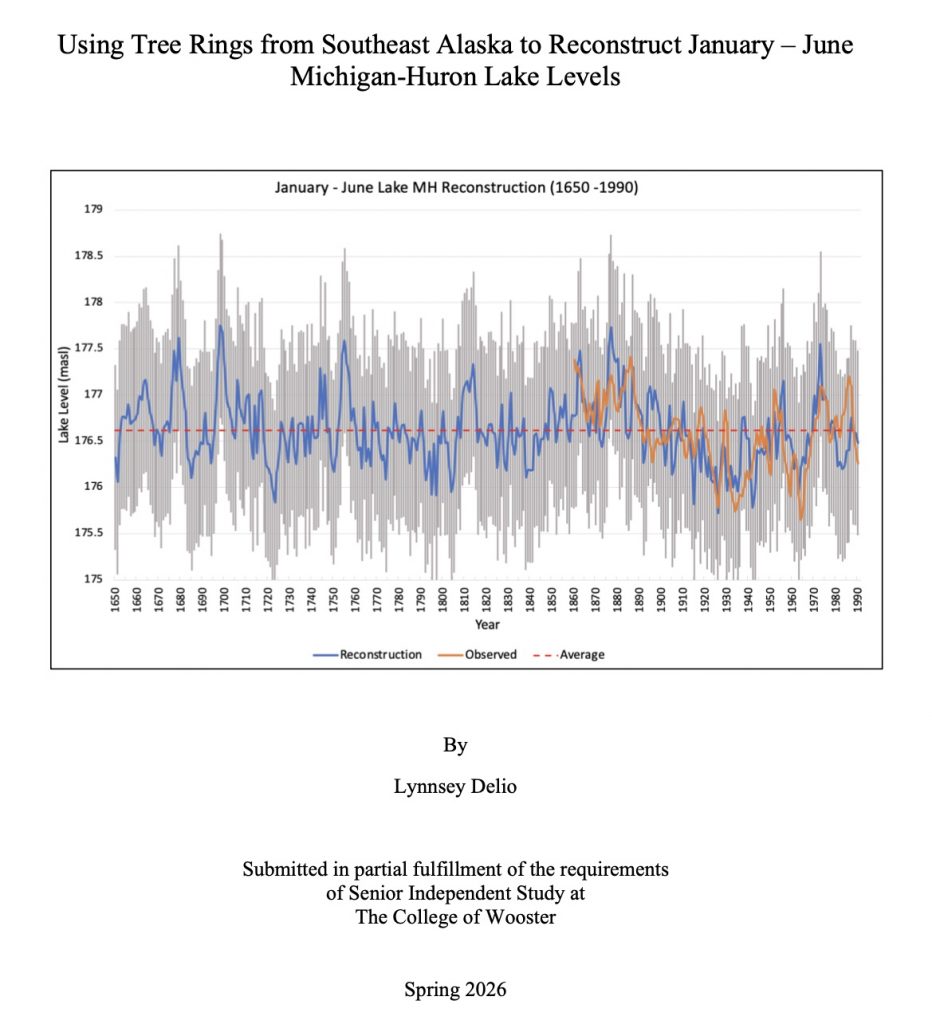
Abstract: Reconstructing and understanding historical lake levels provides information about how climate influences lake level fluctuations, which is important for managing Lake Michigan- Huron’s (MH) coasts. This study reconstructs historical MH lake levels using ten ring-width chronologies from Southeast Alaska, which are significantly correlated at the 0.01 confidence level with January – June average MH lake levels. Tree ring chronologies from Southeast Alaska can be used to create a model of MH because of atmospheric teleconnections, like the Pacific North American Pattern (PNA), which produce similar atmospheric pressure anomalies across both regions. The model explains 33.8% of the variance in MH lake levels (January – June), and the validity of the model was tested through a series of calibration and verification statistics, confirming a well-verified stable relationship through time.
Findings indicate that MH lake level fluctuations are primarily based on large-scale atmospheric climate patterns that may be altered by human activity, volcanic eruptions, or strong climate events. Reconstructed high lake levels are attributed to volcanic activity in the 1690s, 1673, 1755, and 1809 and a strong El Niño event from 1876 to 1878, whereas lows are attributed to droughts, corresponding with the conditions of the 1930s Dust Bowl. MH lake levels are negatively correlated with the Pacific North American Pattern (PNA), indicating higher lake levels during a negative PNA. Understanding why lake levels reached highs and lows in the past will give insight into lake level behavior in the present and into the future, helping manage MH’s coasts and protect shorelines.

Lynnsey explaining the results of her project at senior I.S. Symposium.
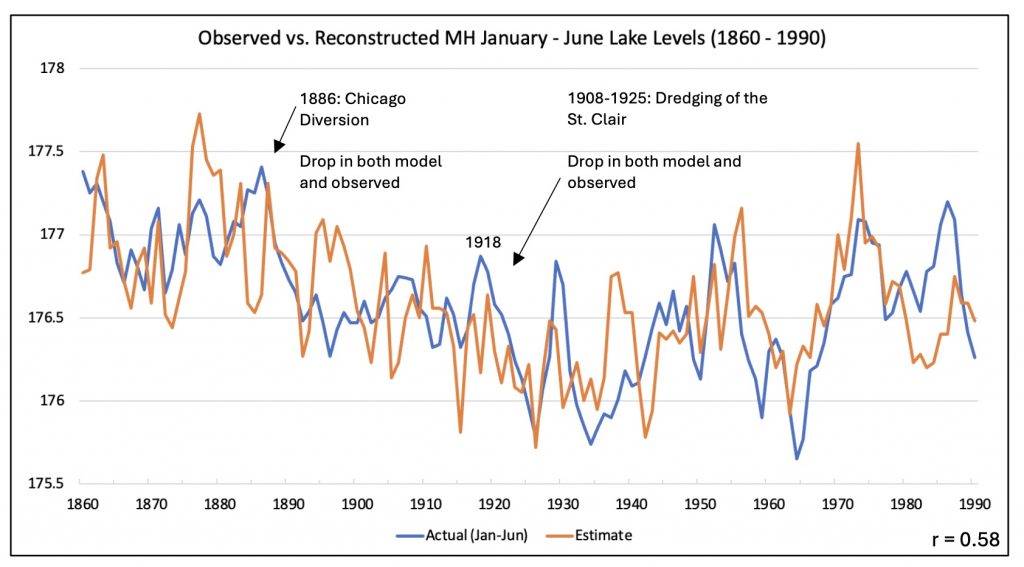
Reconstruction lake levels vs. actual lake levels (Jan – June). Drops in lake levels occur after the dredging of the Chicago Diversion (1886) and the dredging of the St. Clair River (1908 – 1925). However, the model also depicts drops at the same intervals, so these events may not have had an extraordinary impact on lake levels.
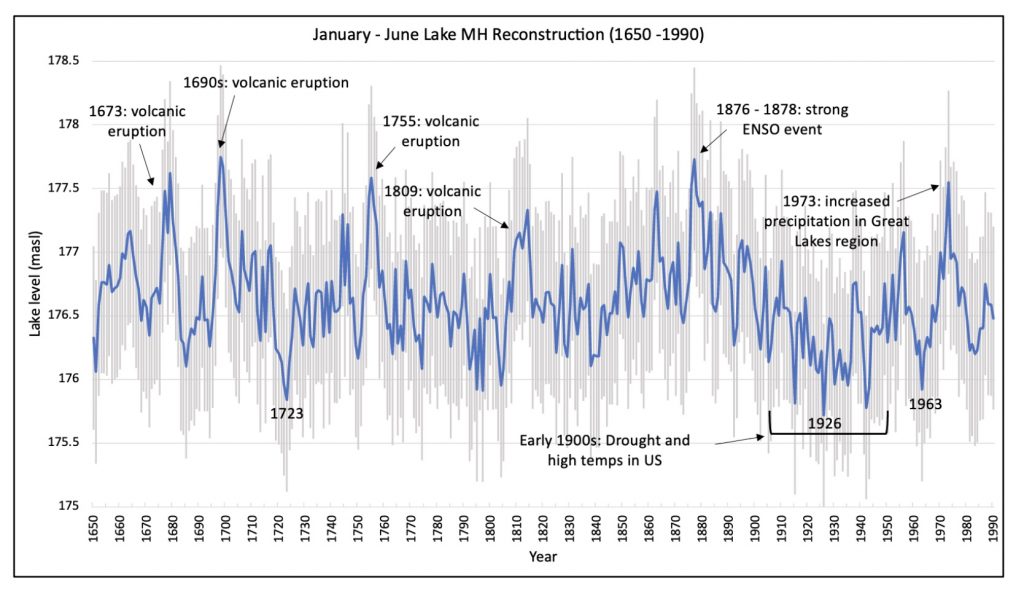
Reconstruction of January – June MH lake levels (1650 – 1990). Many of the early highs are linked to volcanic eruptions and later highs and lows are linked to regional or global climate events. Gray bars represent the 95% confidence interval derived from the root squared mean error (RSME).
Well done research, Lynnsey! I saw those wiggly lines and instantly knew you were a Dr. Wiles student. Your work is another example of the amazing global connections mediated through climate. That trees in Alaska can help explain water level fluctuations in the Great Lakes is fascinating. I was just reading about another historical connection between volcanic activity in the 1690s and famine in Scotland which led to a failed colonial project in Panama (the Darien Scheme) that in itself crashed the Scottish economy. So many connections in the Earth sciences. Congratulations on completing your IS. Best wishes for your future!