


Guest blogger – Dan Misinay
During the summer of 2014 Dr. Wiles and I.S. student Sarah Fredrick traveled to Kamchatka, Russia. While there, they cored hundreds of birch (Bertula ermanii) and larch (Larix gmelinii) trees to bring back to the tree ring lab and be analyzed. The cores were mounted, sanded, counted, and measured. This study is important because very little work has been done with Russian birch regarding climate reconstruction. The work that I have been doing so far this summer has been strictly with the birch trees.
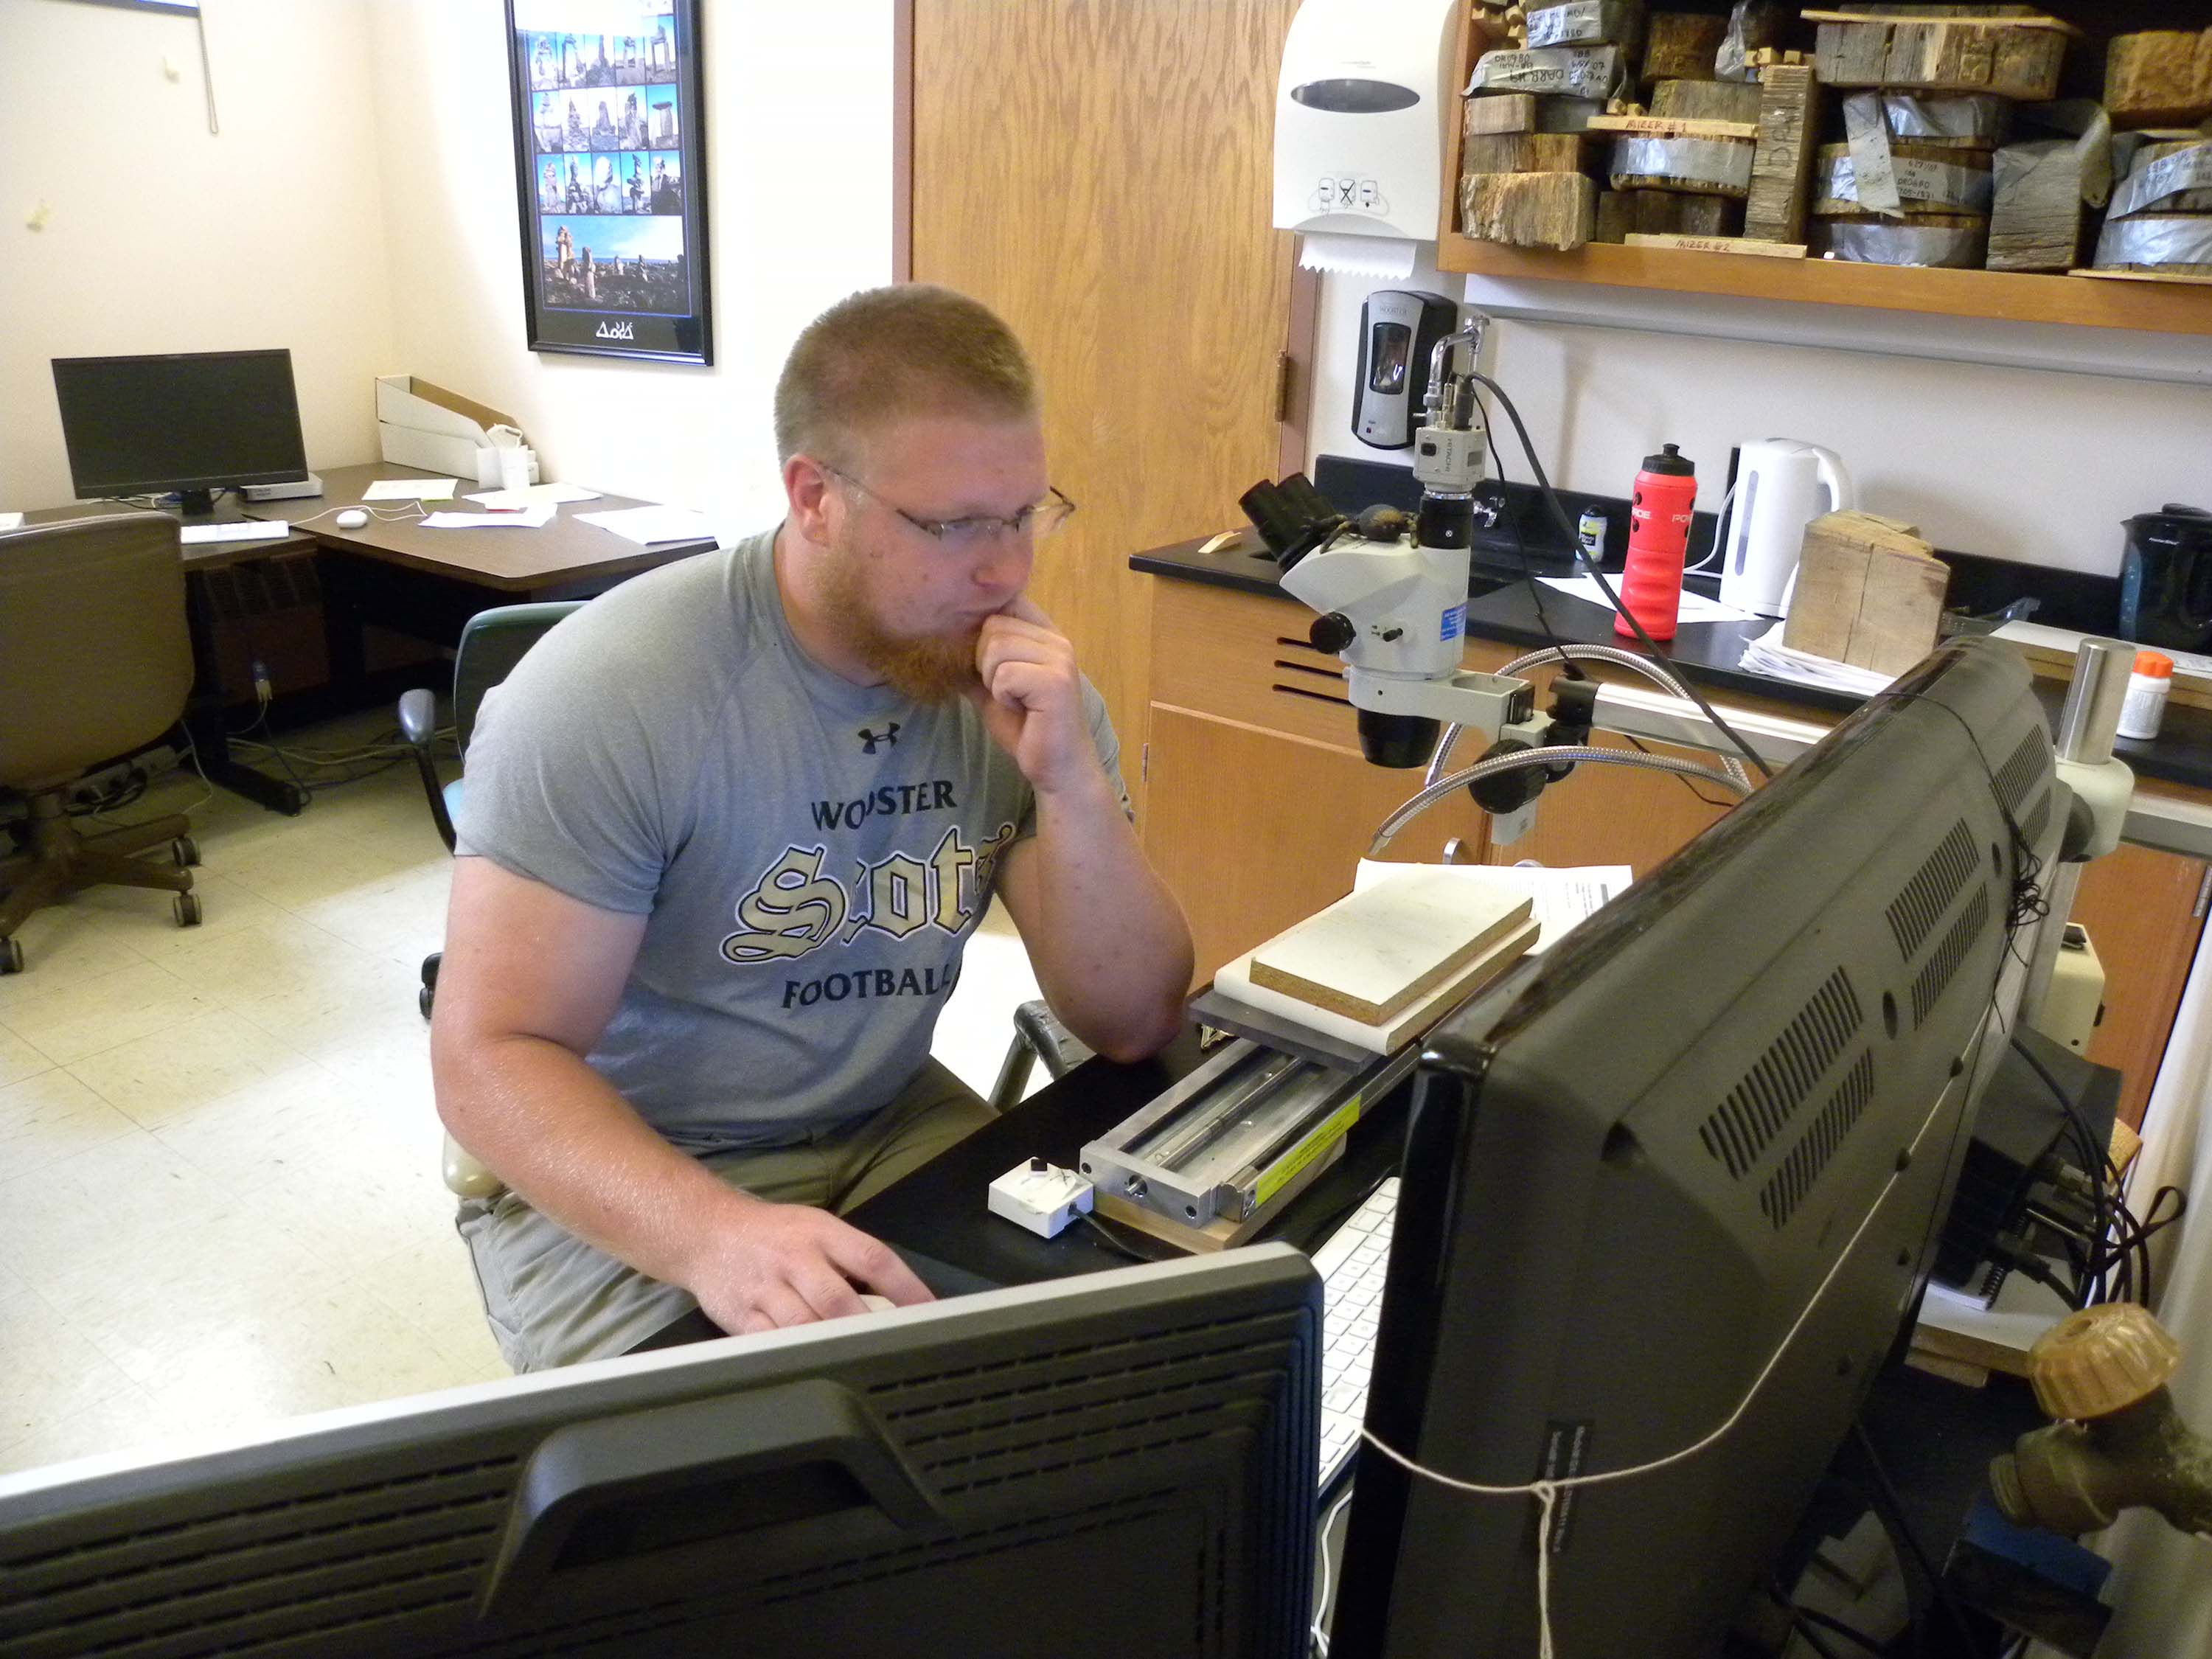
Hard at work with COFECHA and measuring cores.
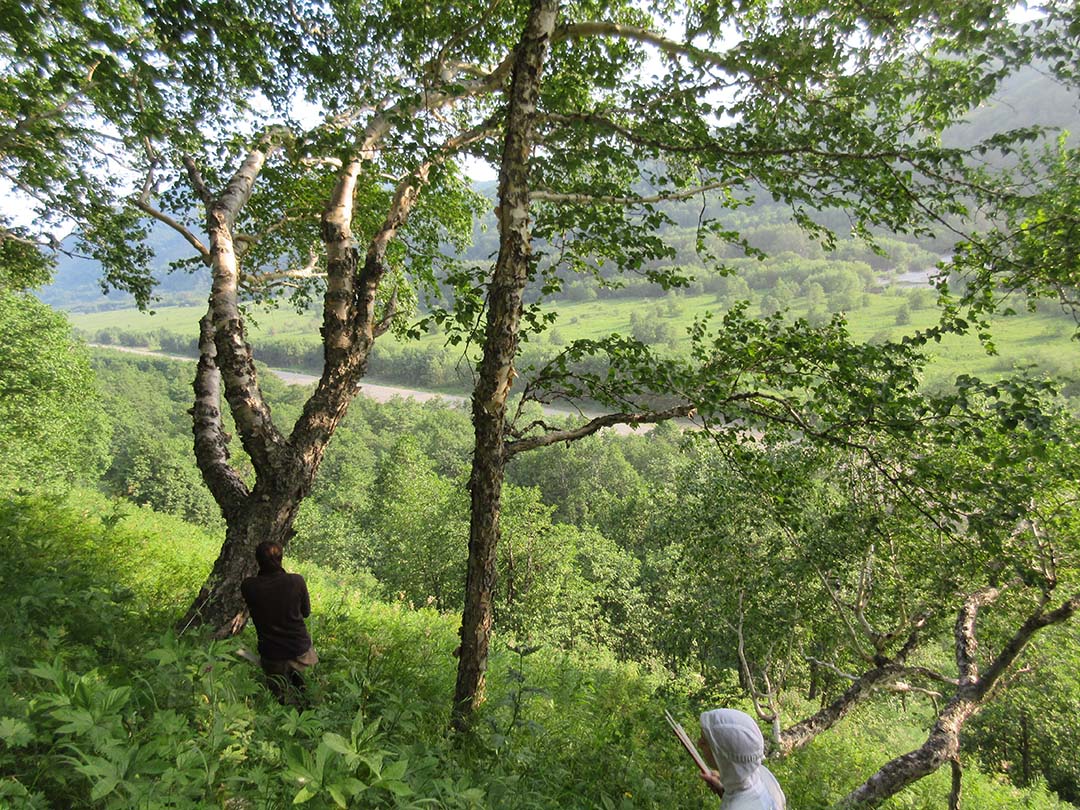
The birch forest growing on steep slopes in Kamchatka.
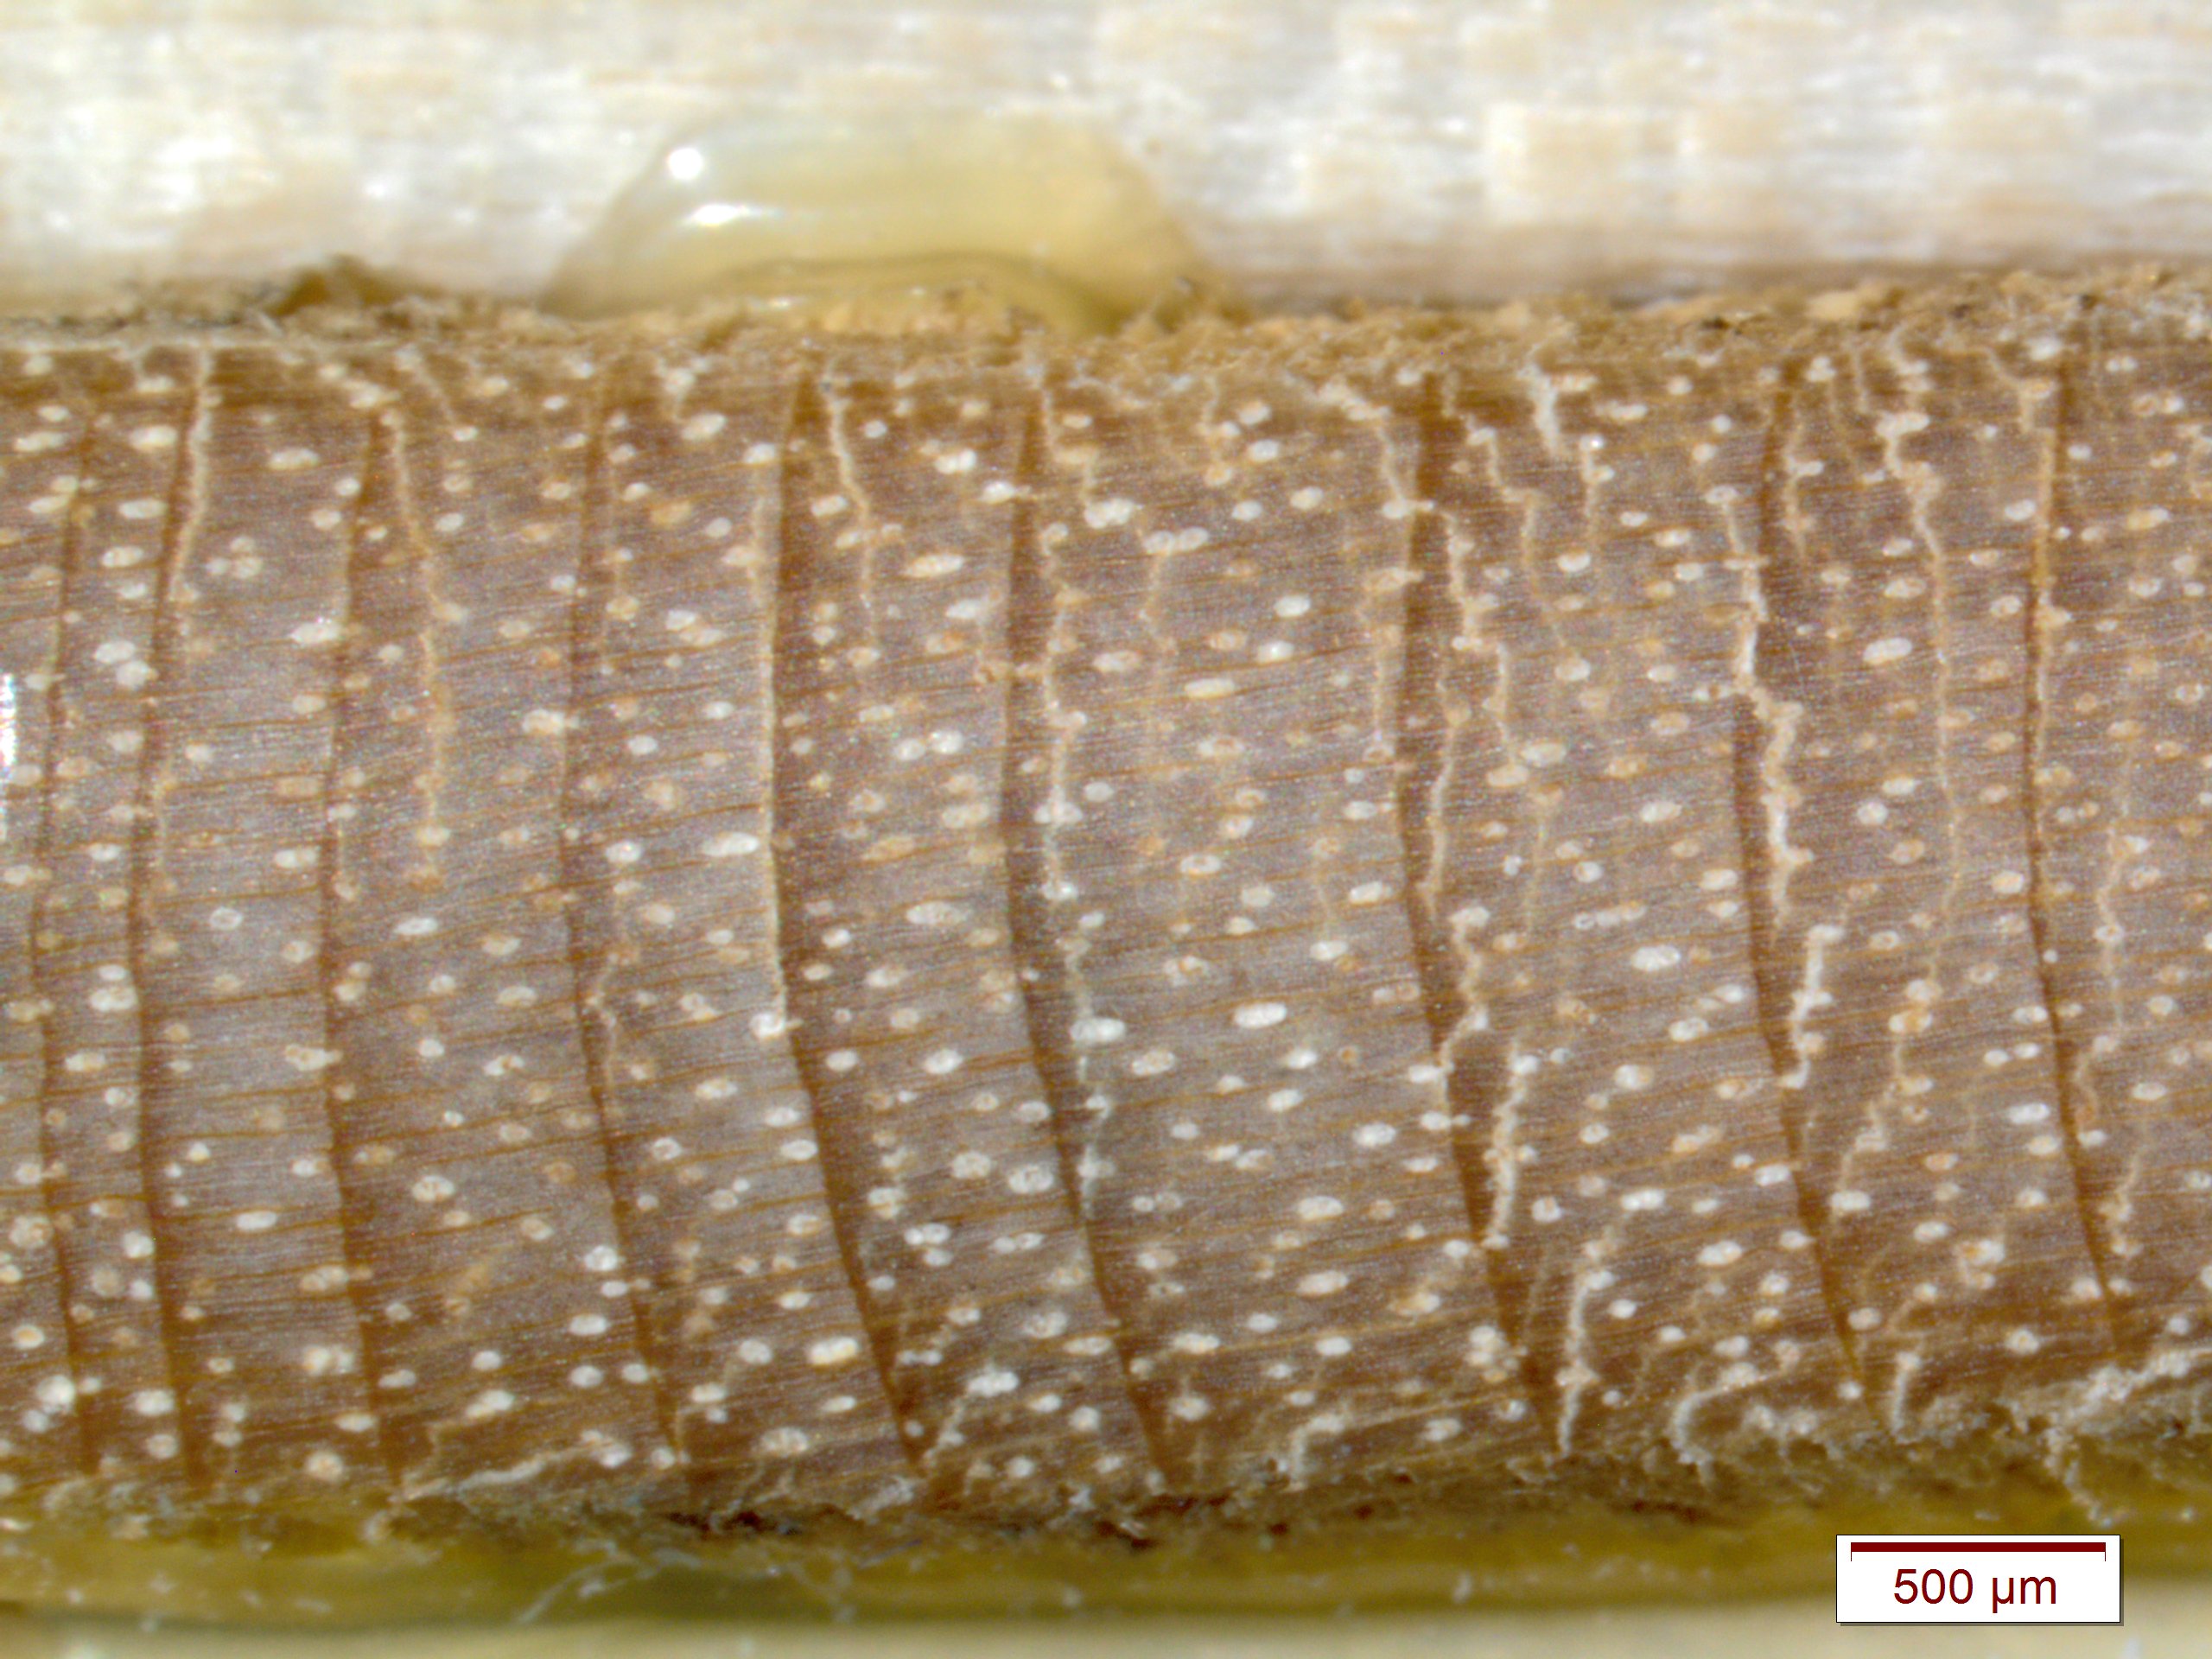
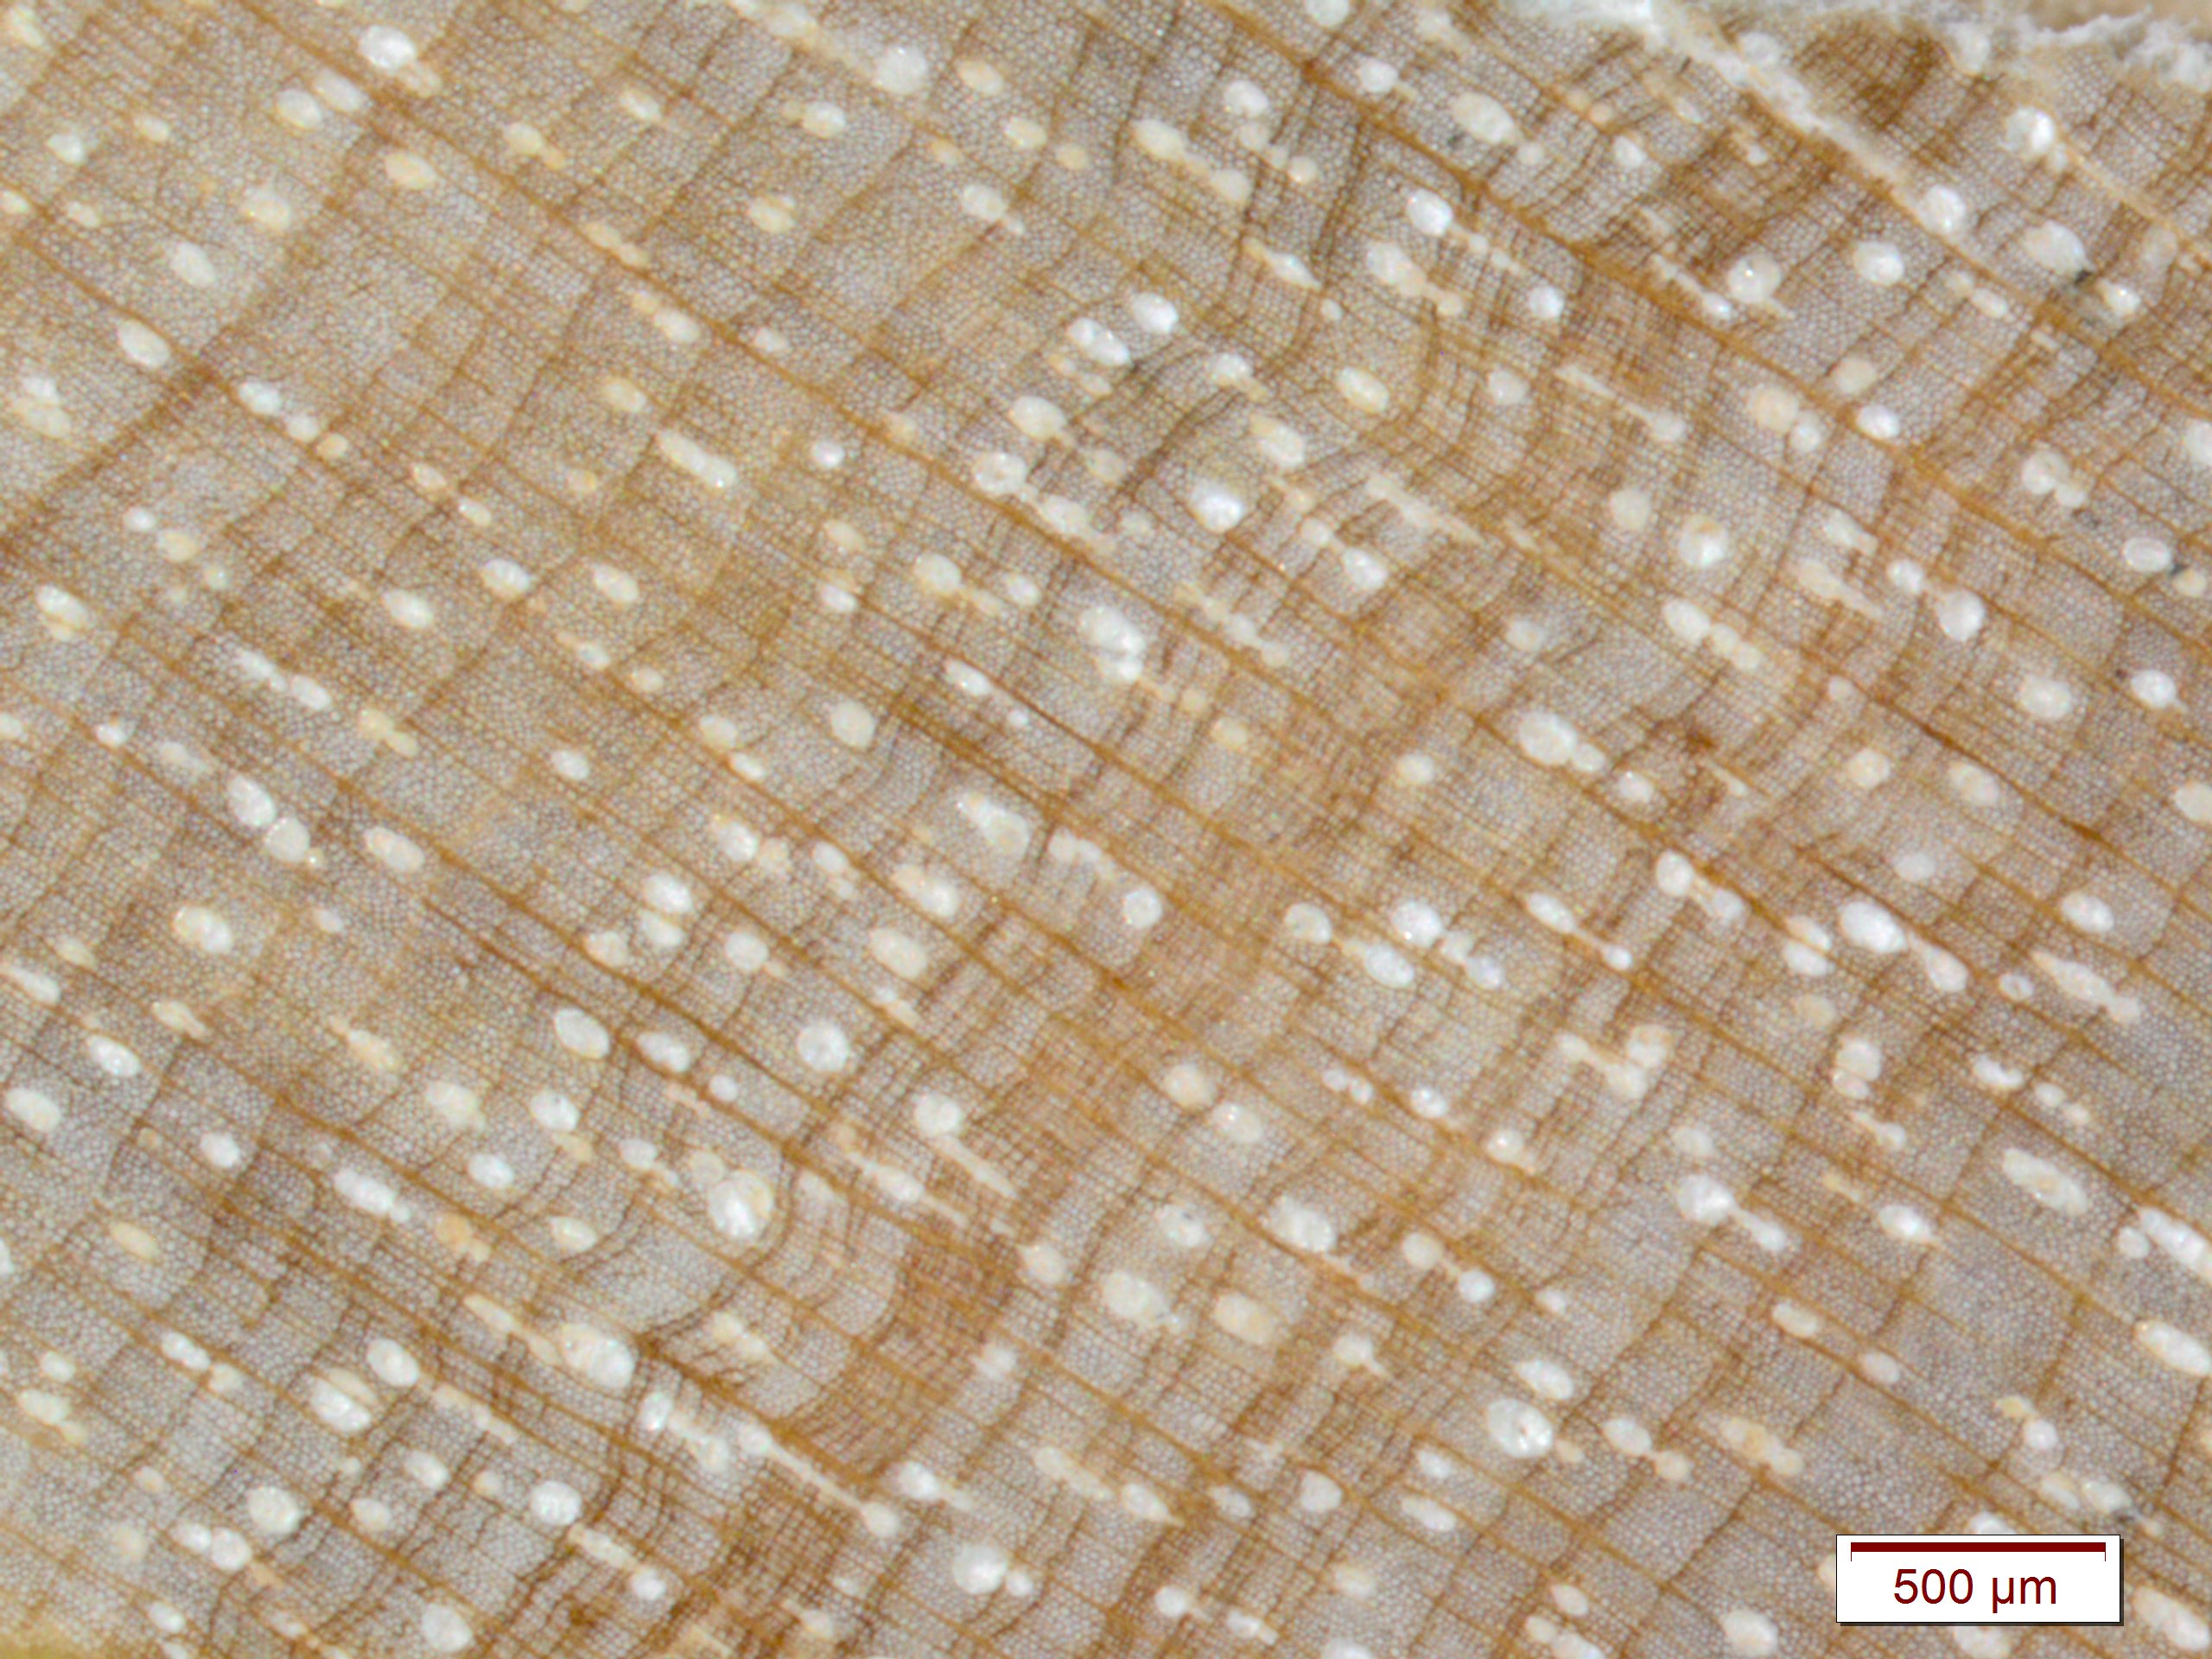
Photo of sample UG05 of normal growth rings in the birch.
Rapid growth occurring in 90 percent of the samples. Possibly caused from warming or increased precipitation.
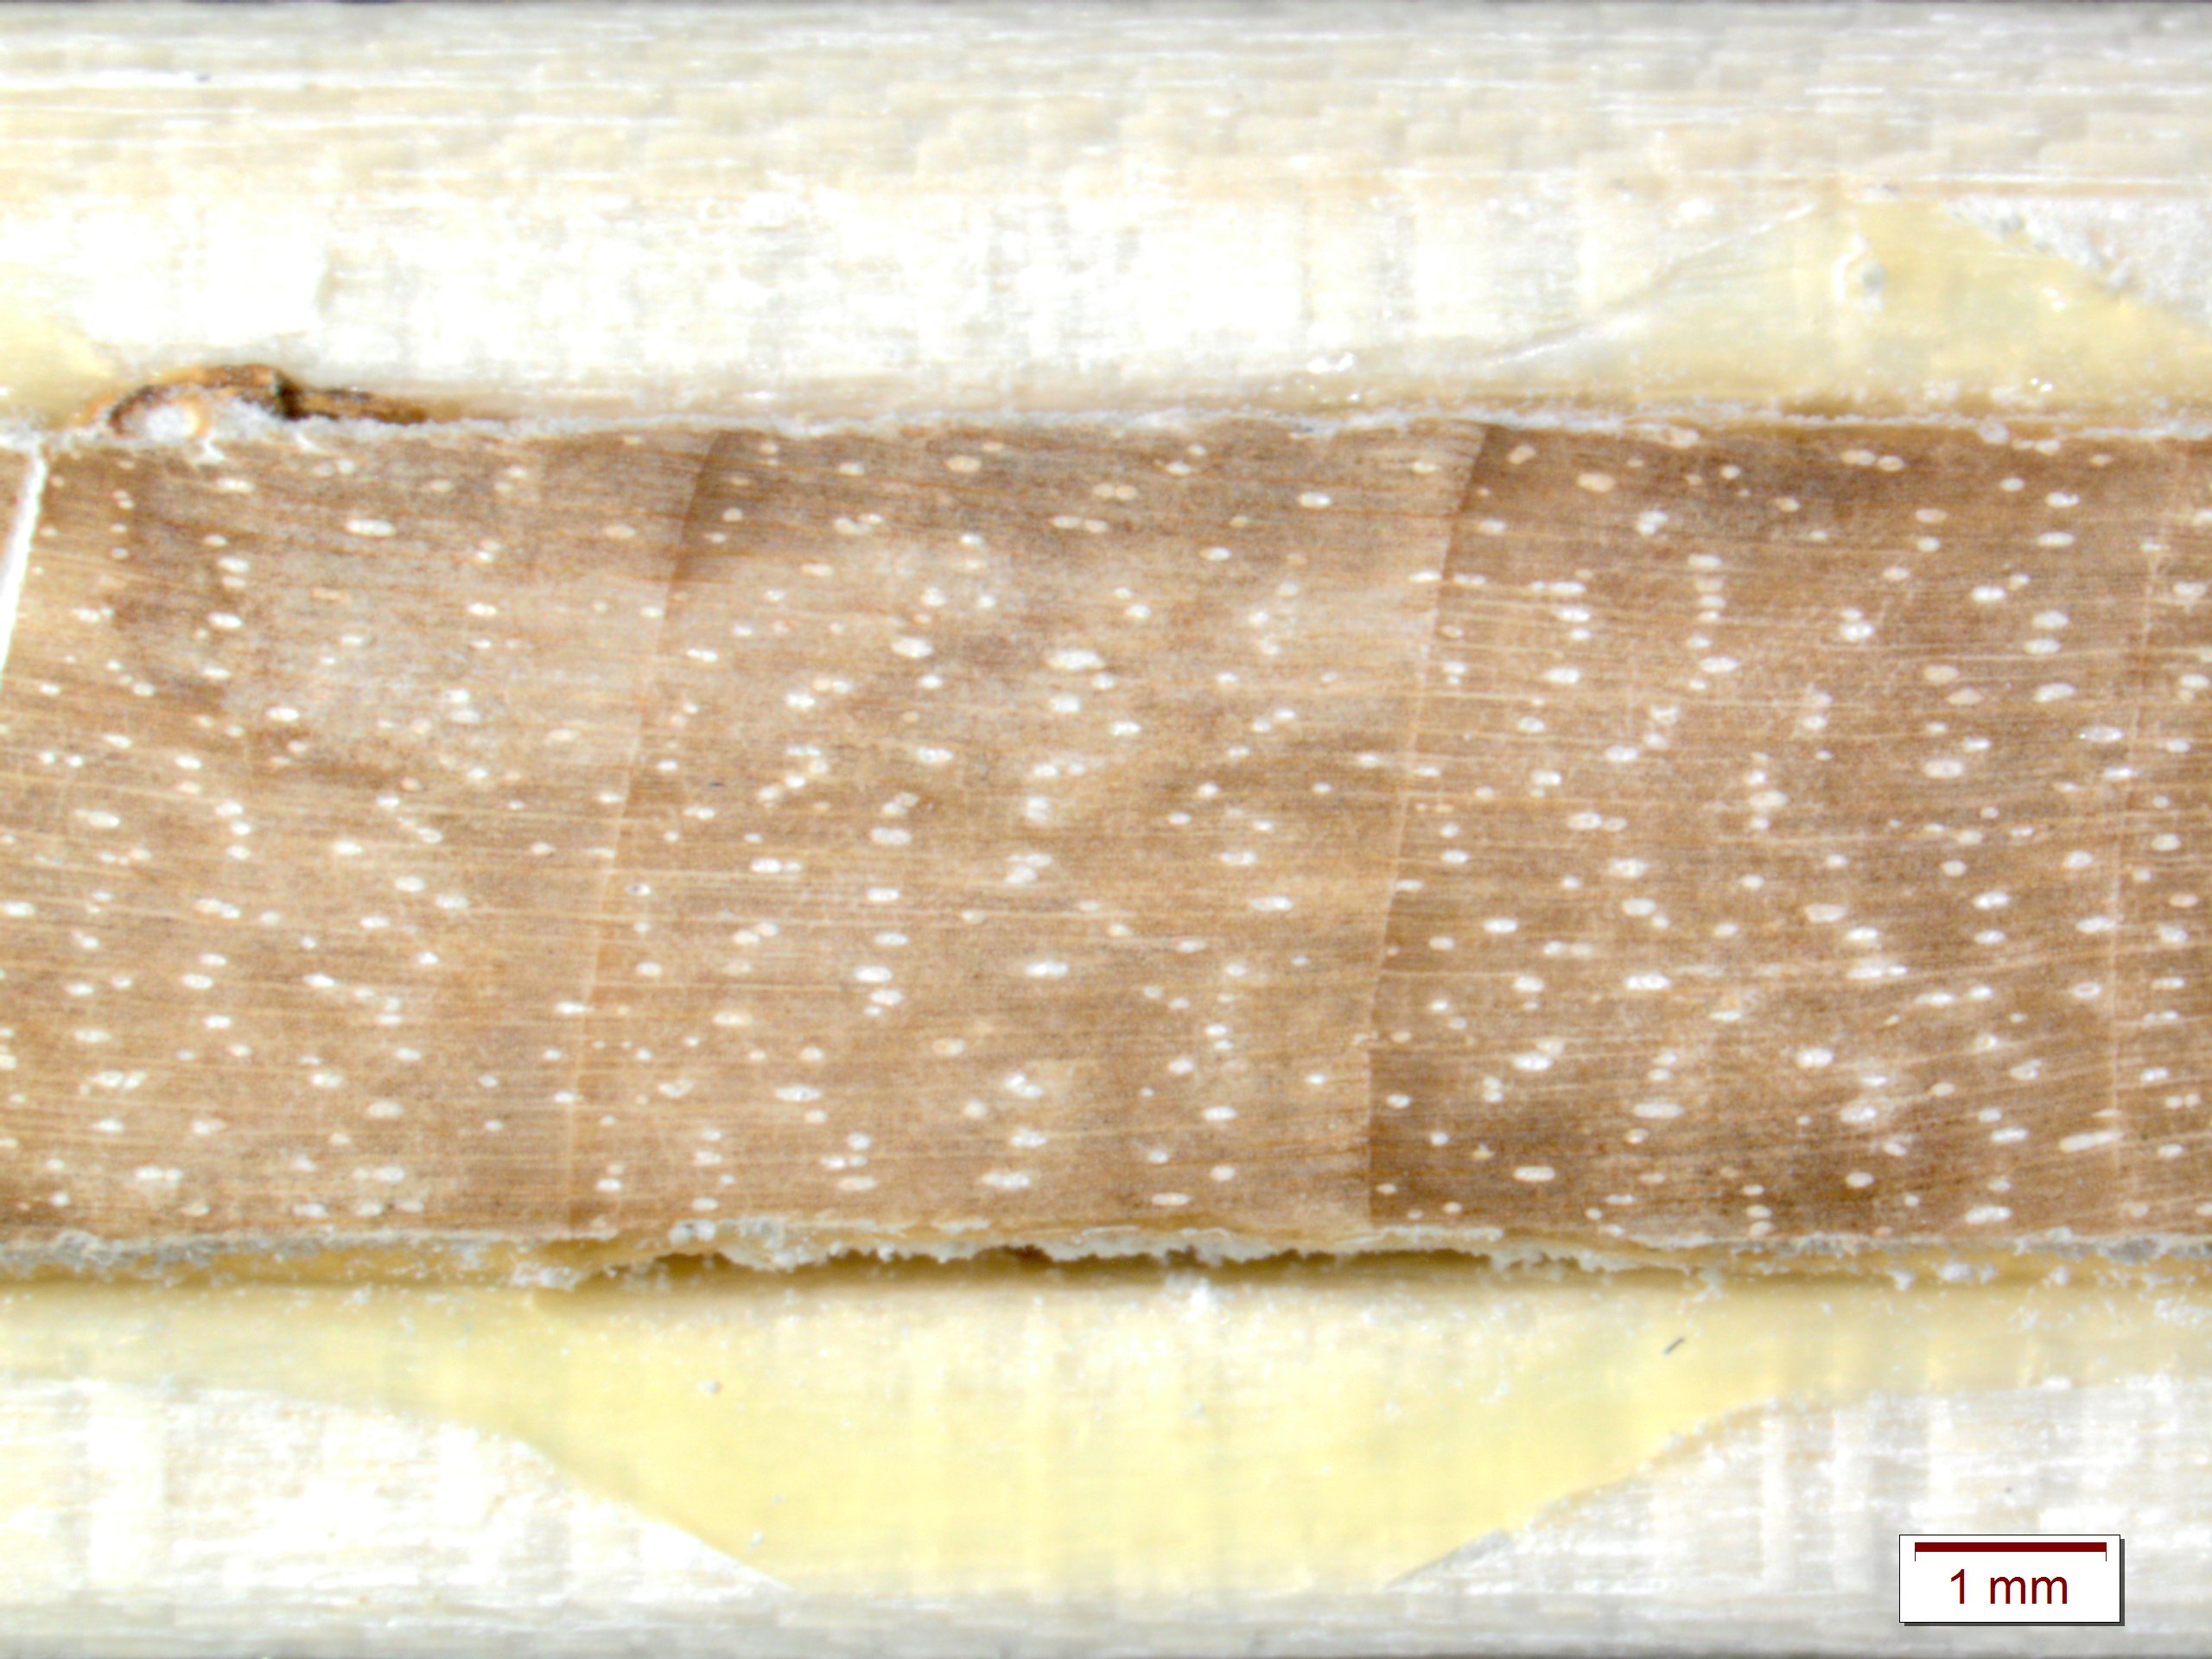
One of the many challenges with the birch trees were these patches of narrow rings. This growth occurred from 1990-2013 and or 1930-1960 in many of the cores. This growth could be caused from climate change or pollution in the surrounding environment. Additionally the rings at this site may be reacting to being on a slope, or the tree is slowly dying.

Birch with small rings, notice one of the rings is much lighter than the rest of the wood. These changes occur between 1825 and 1875 in some of the samples.
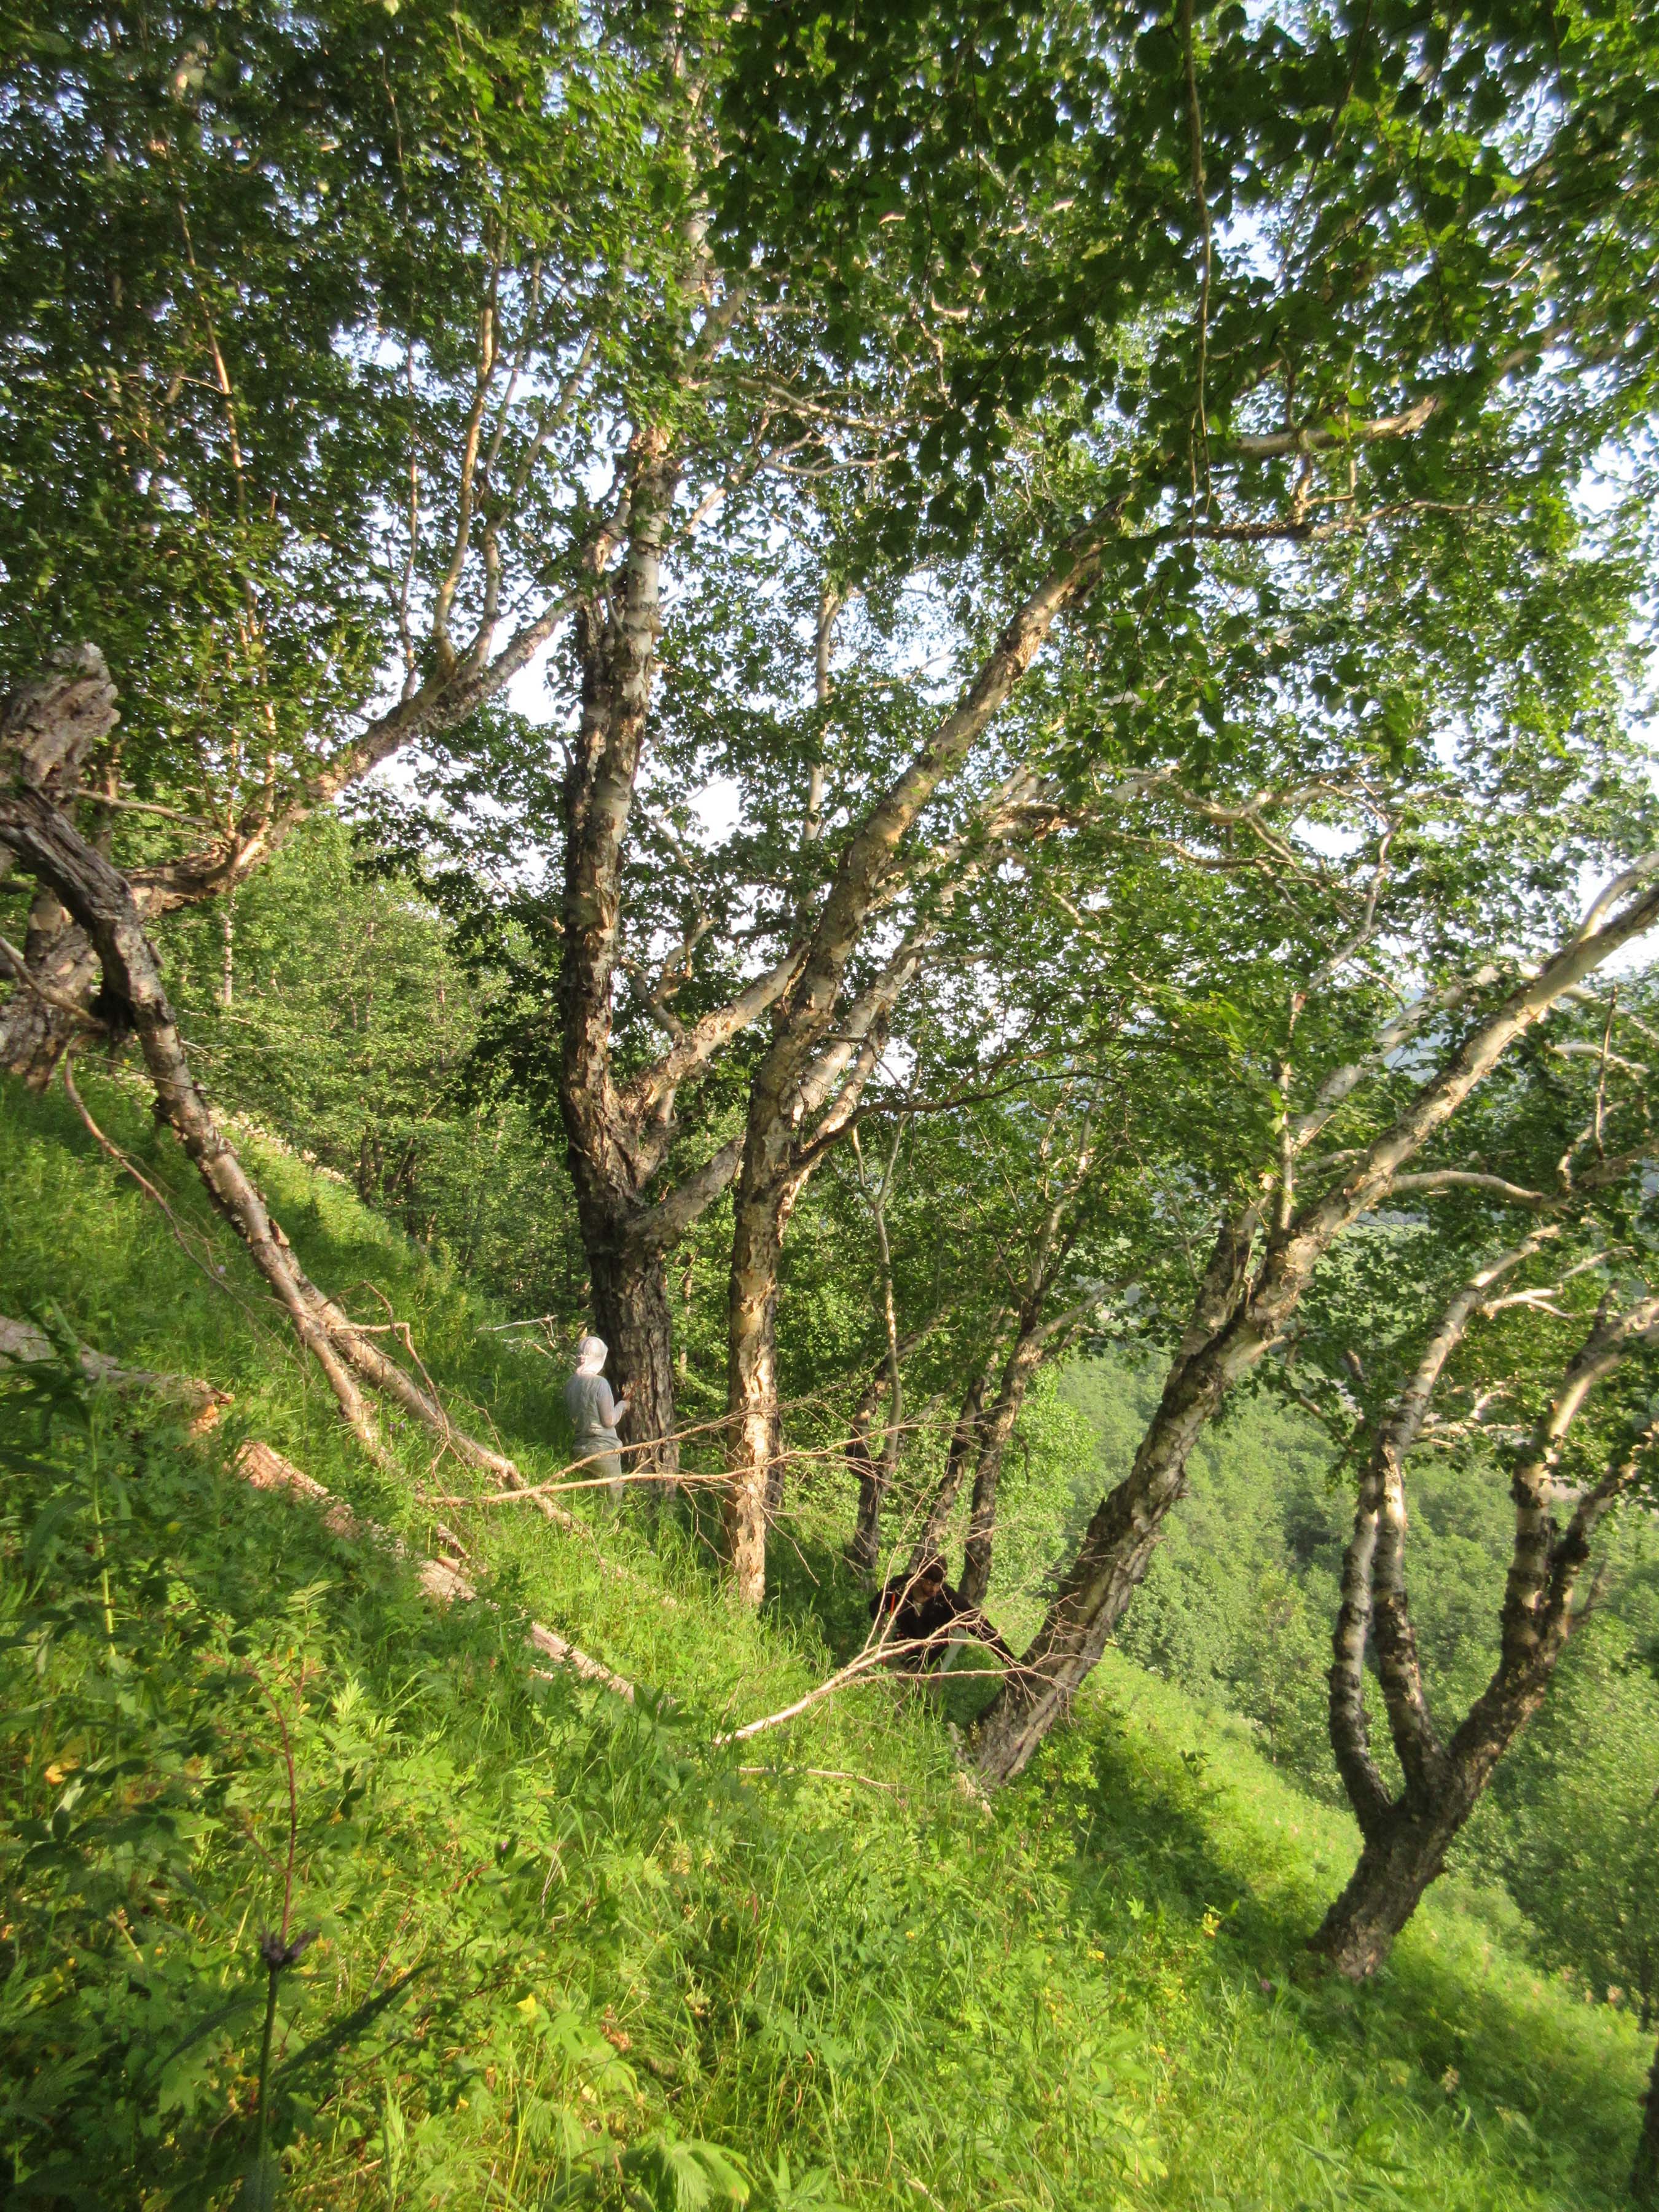
Another photo of birch trees growing in Kamchatka. Some of the abnormal ring growth could be linked to the growing conditions. Trees the grow on slopes generally have reaction wood which will cause the ring to grow much larger on side of the tree than the other. The side opposite of the reaction wood is generally very narrow and rings are pinched out.
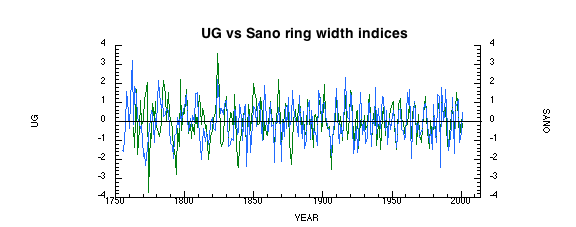
UG site from Kamchatka plotted against results from Sano et al, 2009. These are raw ring width measurements correlated with one another. UG site measurements are represented by the green line and Sano’s data is the blue line.
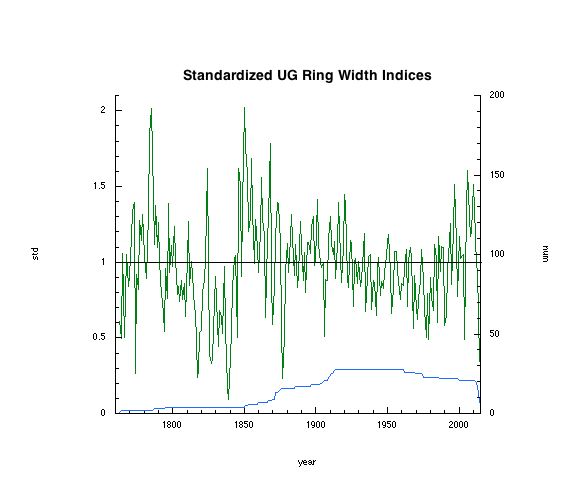
The above graph is the UG site chronology after being standardized. The growth trend is removed so that the desired climate signal is only showing. There are many trends through out the graphed that will be addressed later in the summer when the climate reconstruction is completed. The blue line on the bottom represents the number of samples at each given year.
References
Sano, M., Furuta, F., and Sweda, T., 2009, Tree-ring-width chronology of Larix gmelinii as an indicator of changes in early summer temperature in east-central Kamchatka: J For Res, v. 14, p. 147-154.
Nice job, Dan!