


The other day while on the phone with my sister, she complained about how bad the weather was. “It’s rained like every day since April 1st” was the statement. That was an exaggeration, so she then modified that statement to say it’s been really wet this spring, and she’s had few opportunities to let the boys play outside in the sun. So then I wondered… is she right? Or is she just participating in a favorite past time of complaining about the weather? She lives north of Boston, so I decided to take a look at the data from a long-running station at Lowell, Massachusetts.
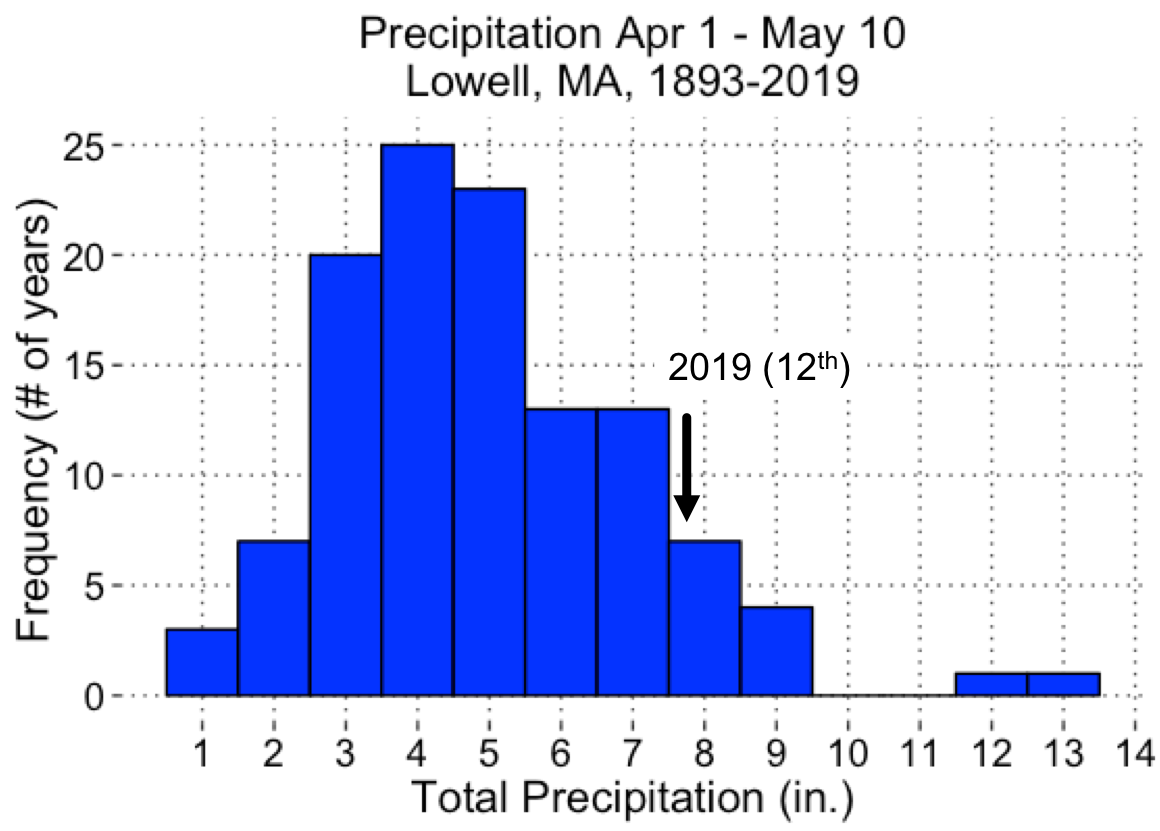
Distribution of total precipitation between April 1 and May 10 in Lowell, Massachusetts
It’s true that 2019 has had a wet spring. Of the 127 years of data at Lowell, 9 years had enough missing data I had to toss them. That leaves 118 years. Of those, 2019 has seen the 12th most precipitation between April 1 and May 10 (7.73 inches; the 91st percentile). However, my sister has only lived near Lowell for about 15 years, and in those 15 years, 2019 ranks 5th… so above average, but nothing special. In fact, neither of her sons has experienced fewer than 6 inches of rain from April 1 through May 10… all they know is wet springs!
Before I called her back to tell her she’s exaggerating, I decided to dig a little deeper. You see, my sister didn’t actually say there’s been a lot of rain; she said there had been many rainy days. That’s different. If we track the percentage of days on which rain (sometimes with snow) fell in Lowell since April 1, we find that my sister is on to something. It has rained 25 days — about 62% of the days since April 1 — and that is a record. Yup, in 118 years Lowell has never had so many rainy days between April 1 and May 10. My sister’s smart, but I didn’t expect she’d be that good.
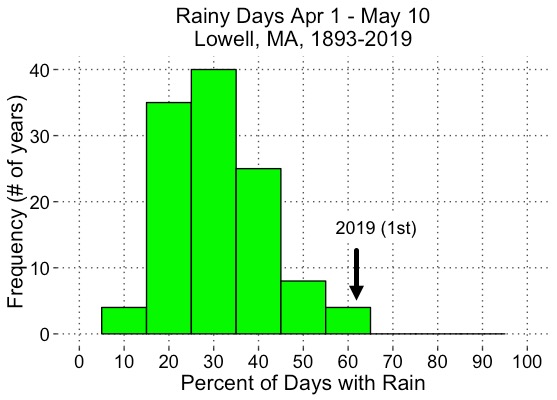
Distribution of the days between April 1 and May 10 with precipitation greater than 0.01 inches in Lowell, Massachusetts
Anyway, the lesson here is that my sister, like many people, would rather have a lot of rain on a few days than a little rain on many days. It’s not the rain so much as lack of sun that gets to people. This is partly why a city like Seattle (36 inches/year) is famous for being rainy even though cities like Cleveland (39 inches/year), Boston (44 inches/year), and New York City (50 inches/year) all receive more precipitation. It’s not that Seattle gets a lot of rain; it’s that it’s often raining. Seattle has 152 days with precipitation a year, but Boston only has 126, and New York has only 122. Think about that — NYC gets 38% more precipitation but 30 extra days without any precipitation!
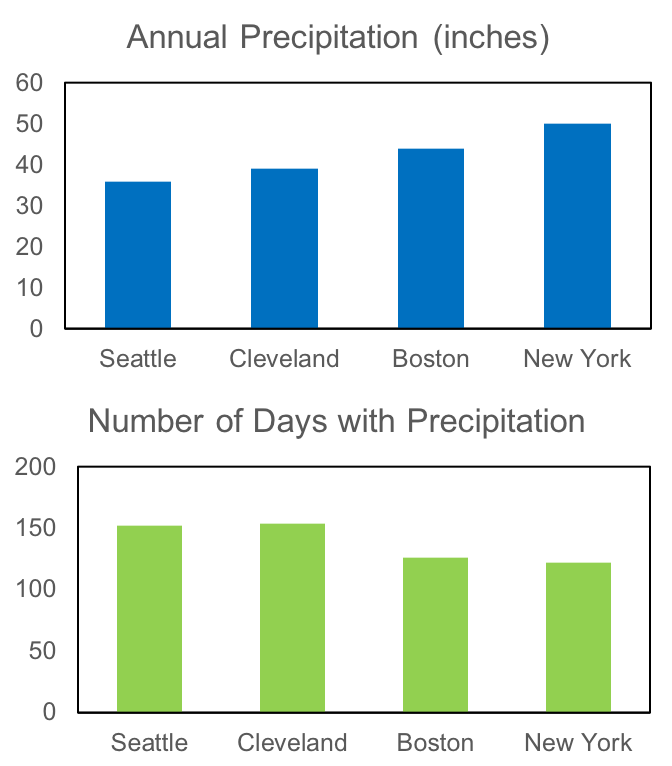
Total annual precipitation and number of days with greater than 0.01 inches water equivalent of precipitation in four US cities
Cleveland, for the record, has 154 days with precipitation a year on average thanks to it frequent lake effect snow. All data are from NOAA’s Climate Data Online.
Those NCDC data sets are (unexpectedly) fun to parse, Alex. I like the old metrics of “percent sunniness” and “cloudiness,” which have been partially discontinued (some were based on automated sensors, some by physical observation, and I think % sunniness has been discontinued, but cloudiness persists, and is measured in some obscure quantity called an “okta,” or something like that??). But, there’s a huge amount of information in those data sets, and a lot of interesting conclusions can be drawn from their analysis, if one takes the time to go through them in detail!
BTW, I saw that IM Pei, the architect who just died, was the designer of the NOAA facility in Boulder. I hadn’t realized that. I have seen that building from the higher edges of the Chautauqua Park, on the edge of Boulder, and always admired it, but I hadn’t realized it was one of his trademark designs.
Yeah, it’s spotty to find % sun or % cloud in these NCDC records, but I really love the ability to make long-term comparisons. And, yes, it’s definitely okta! I’m pretty sure that comes from being in eighths (i.e., 1 = 1/8, 2 = 2/8, etc.). Does that ring true?
That’s a cool factoid about the NOAA facility, by the way. I went there several times in grad school.
Glad to hear that I am on point.