Guest Bloggers: Li Winner and Aaron Walters
Dr. Wiles’s 2025 Hydrology class visited Spangler Park this past Monday. The day was sunny and warm. The main objective was to study the geological history and hydrology of the park. Especially with how it relates to its glacial and post glacial past, from around 15,000 to present.
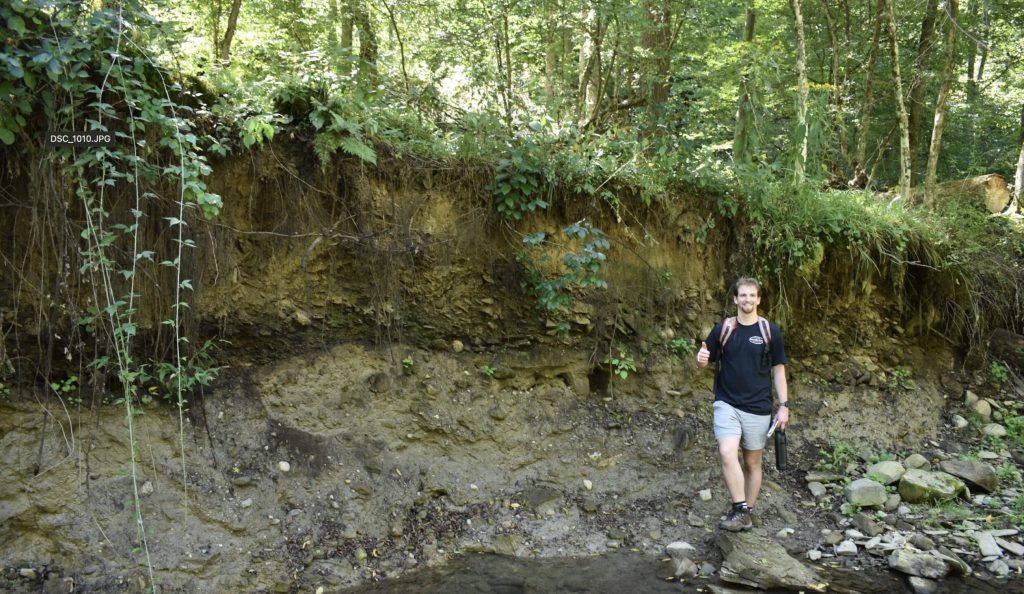
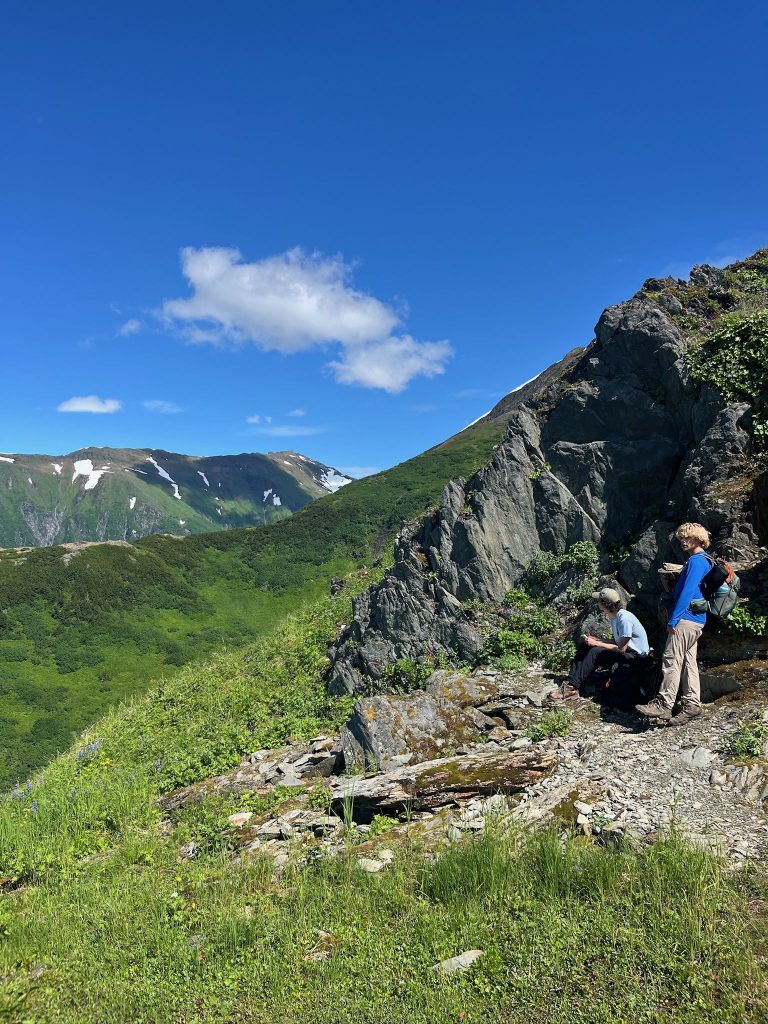
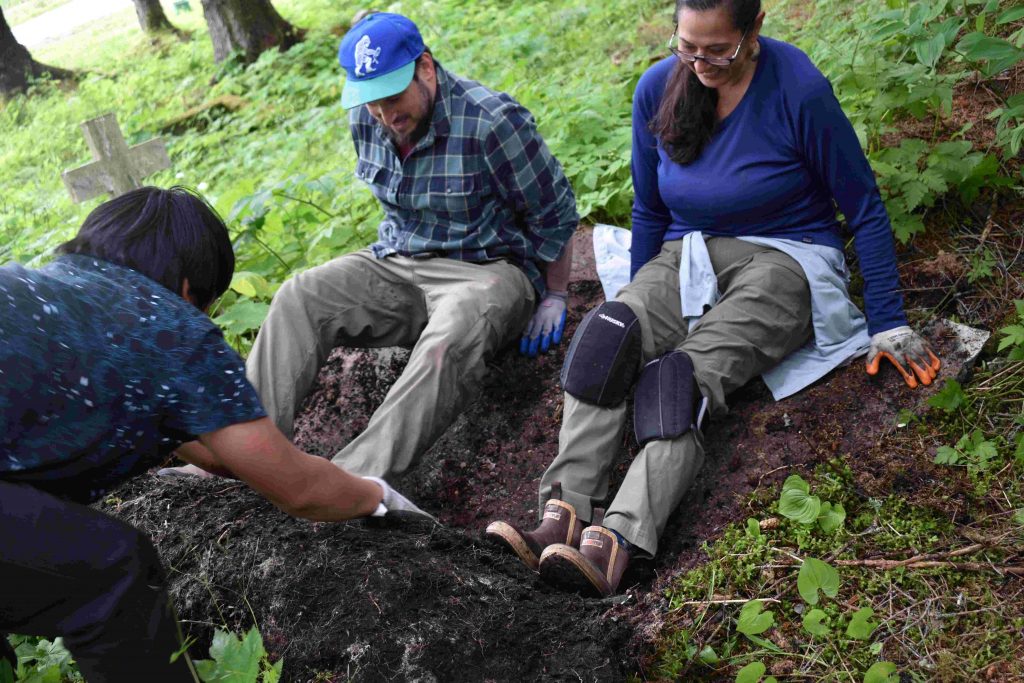
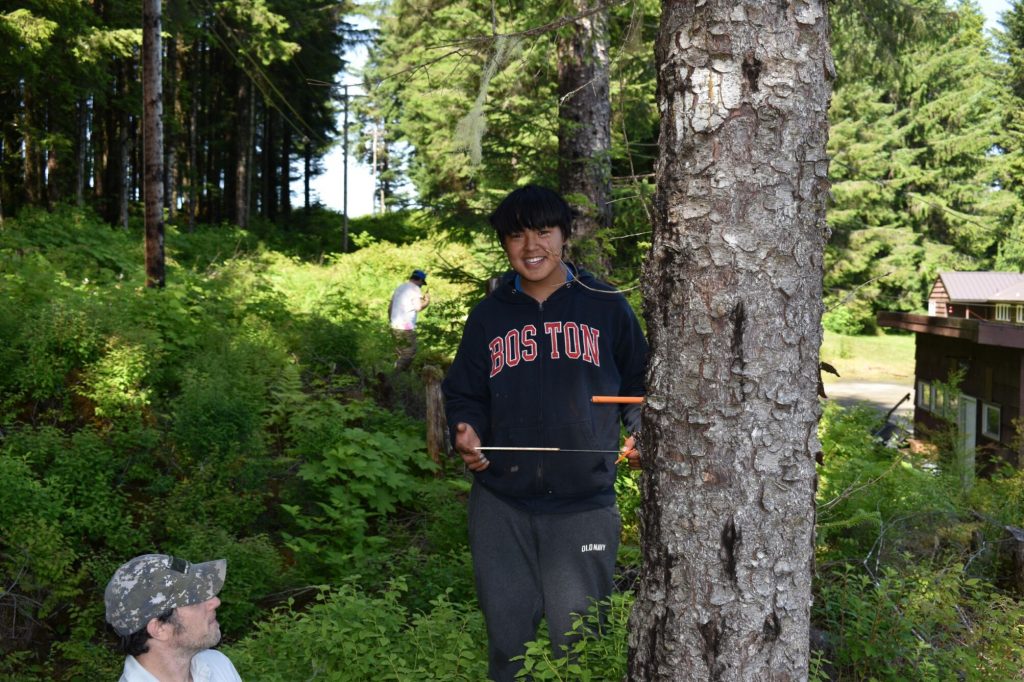
Figure 1: Pointing a disconformity of the top fluvial sediments and the glacial till. The contact is about where Luke’s thumb is located.
Luke (above) is pointing to a disconformity between the top fluvial alluvium and bottom glacial till. The top layer was mainly brought from land use changes beginning during settlement 200 years ago or previous aggradation of Holocene Alluvium. European settlement in the area caused an increase of erosion and sediment deposition from clear cutting of all of the trees in the area and from mill ponds in the area. The bottom is glacial deposition made up mostly of sand and gravel. This glacial sediment formed during the ice retreat of the last ice age around 15,000 years ago. This sediment is impermeable meaning water has trouble to move through it. During rain events water moves through the permeable top alluvium. The water has to move horizontally once it reaches the impermeable till at the disconformity. This horizontally moving water lubricates the alluvium causing it to move and erode.
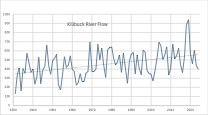
Figure 2. Killbuck River flow from 1930-2024. This is the annual flow that reflects the increases in precipitation in the basin.
Erosion from increasing precipitation as shown in the figure above is occurring more often in the park. This is because climate change is increasing precipitation (figure 2). Increased precipitation also increases the strength of the streams around the park leading to more downcutting. Over time in, figure 2, more bedrock will be exposed from this downcutting. The more downcutting that occurs, the more the streams get disconnected from their floodplains, meaning they can’t flood. Flooding is important to slow down and empty the load of the stream. If they can not do this the water stays constrained in the stream leading to even more downcutting and therefore erosion. Ecological effects can also be caused by increased downcutting due to the lowering of the water table. This can dry up ponds and stress plants that rely on water from the water table. Riparian vegetation which helps prevent erosion is especially susceptible to the lowering of the water table.
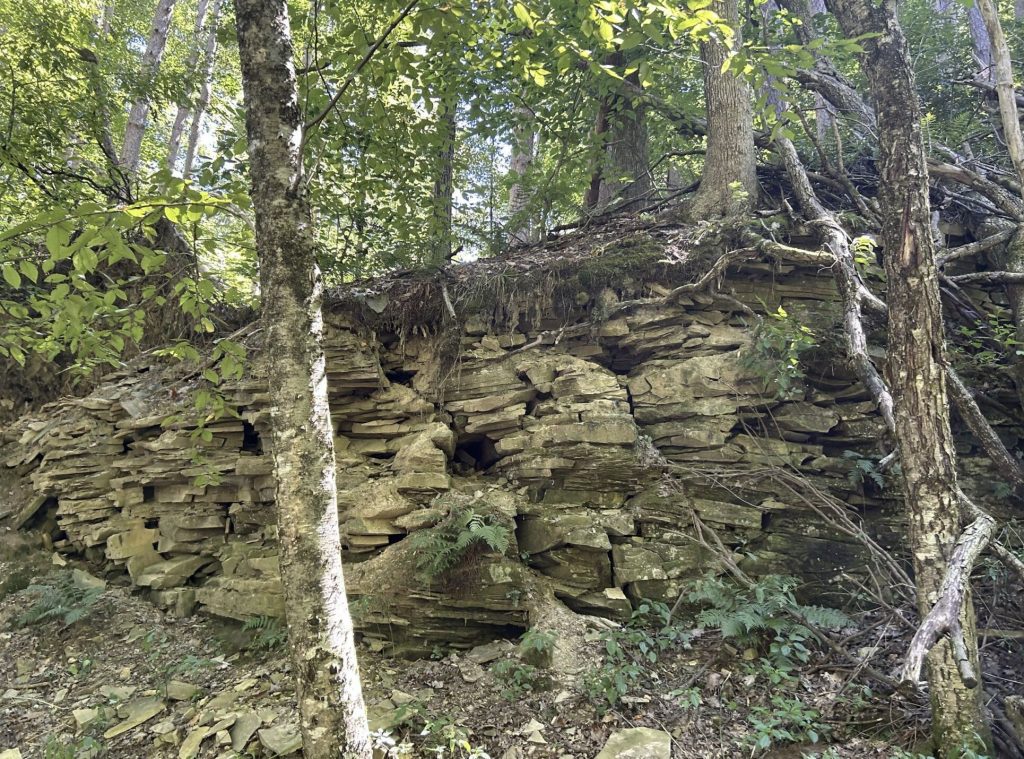
Figure 5: Shale from the Mississippian period. ~330 million years ago. The fractures in this shale, the dominant bedrock in the area, allow water to infiltrate into groundwater, making this area a recharge area. A recharge area is an area where more water enters into groundwater than leaves the groundwater. Fractures on this particular outcrop were formed and are getting larger as it slowly creeps downhill.
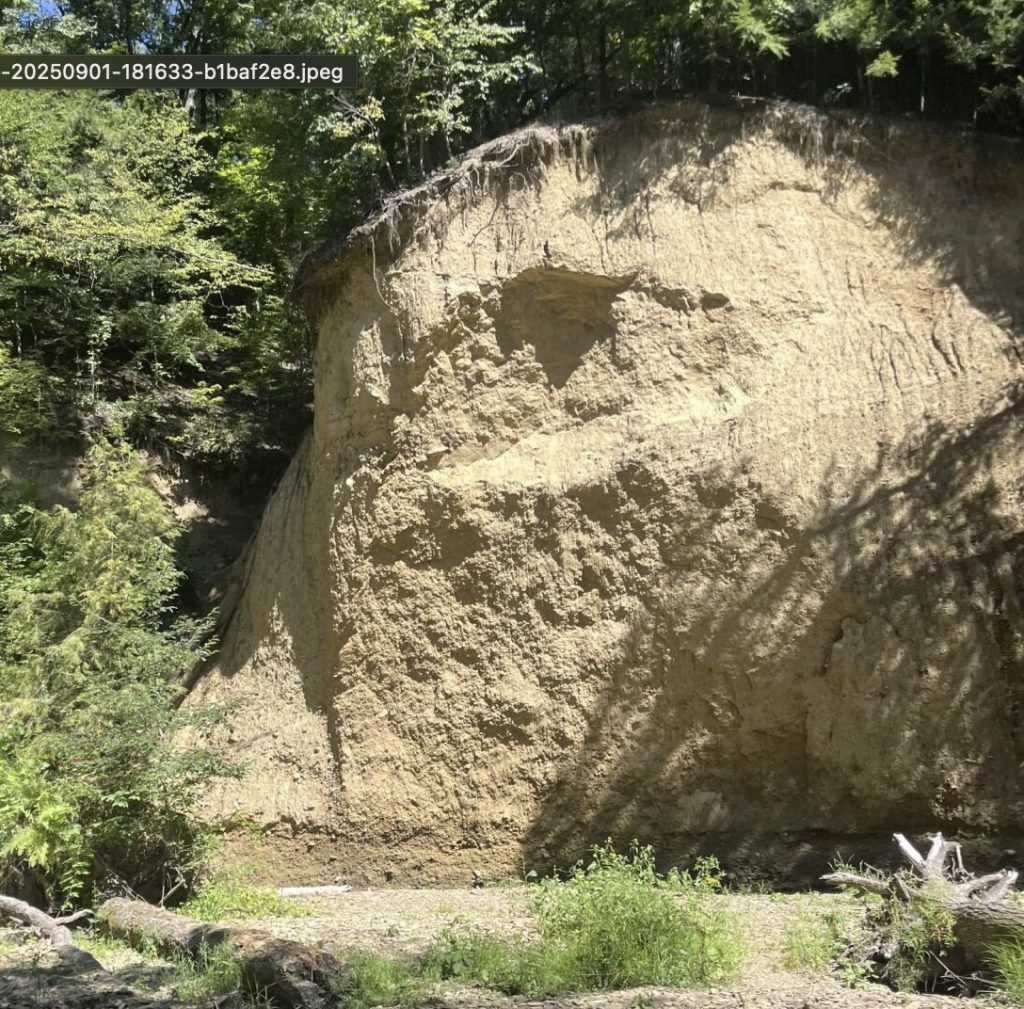
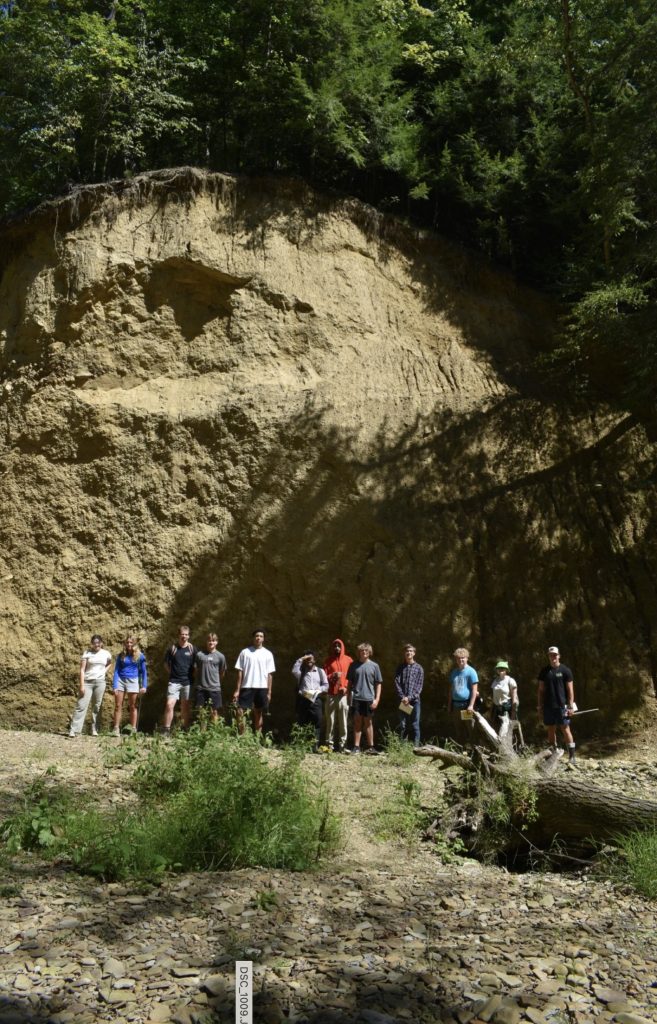
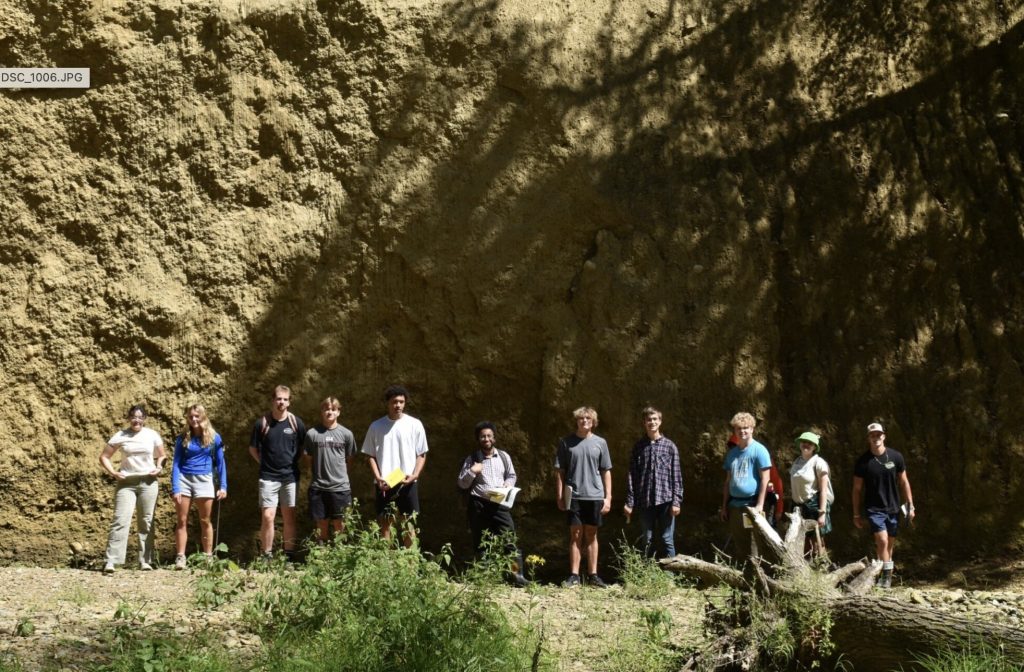
The two photos above depict an outcrop of glacial sediment complex that includes debris flows, fluvial, loess and tills. The area is a buried valley. Around 20,000 years ago, Wooster was covered by the Laurentide ice sheet. Around 15,000 years ago, the ice retreated, carving out this area into a valley. Glaciers drag sediment with them, depositing their glacial till in their wake. The sediment depicted in fig. 5 is brighter than sediments native to Ohio, indicating the sediments were brought here from Canada via glacier. After the glacial till was deposited, a stream formed from leftover glacial lakes made from melted ice and general precipitation. The red line in fig 5b approximates the path the ancient stream took. The sediment below the red line is glacial till, and the sediment above is river deposited alluvium, with young organic rich soil on the very top from the recent vegetation. Also seen above the red line in fig. 5b is an almond shaped hole where sediment has fallen off. A shadow cast makes the weathered area resemble an eye. Figure 5c provides a view of the same area but slightly to the right, highlighting accordion-like vertical patterns on the outcrop. These lines indicate where water seeps out of the outcrop, making this another recharge location.
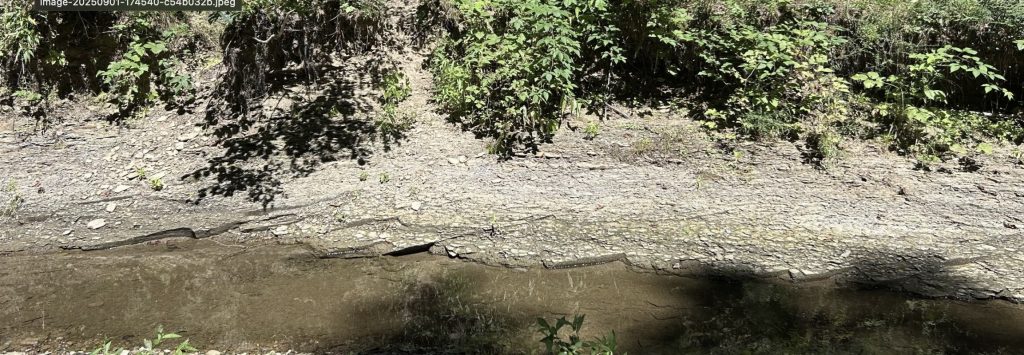
Figure above shows the highly fractured bedrock: the Wooster shale. Wooster shale formed during the Mississippian, making it around 330 million years old. Wooster shale is a sedimentary rock formed from marine sediments during the ancient ocean that covered modern Ohio during the Mississippian. Its blue color indicates that the conditions when it was formed were anoxic, or low in oxygen. The longer a shale is exposed to oxygen, the more red it turns. Wooster often makes use of this shale, firing it to create a bright red Wooster brick! Shale contains clay minerals in its makeup. When wet, the clay expands, and when dry, the clay shrinks. This process makes shale susceptible to weathering when exposed to changes in hydration, causing it to crumble.

The figure above contains an alluvial fan, which is a fan-shaped flow of poorly sorted sediment. Figure 4a displays the alluvial fan in its natural state, which, to the untrained eye, is hard to see. The red lines highlights the path of the sediment down the fan. As a recharge spot, alluvial fans add water into the groundwater below, supplying the aquifer. An aquifer is a collection of water underground with a permeable layer of sediment on top and a nonpermeable layer below. In this case, the clay-rich sediment and shale bedrock and sediment hold Wooster water, while the alluvium above allows water to drain into the aquifer. Wooster aquifers provide water for many of her people—the rest relying on personal domestic wells, which still come from groundwater, just not the main aquifer. Alluvial fans are such powerful recharge systems that pig farming had to be banned on them in Wooster because the waste drained through the Alluvial fans, contaminating the aquifer.
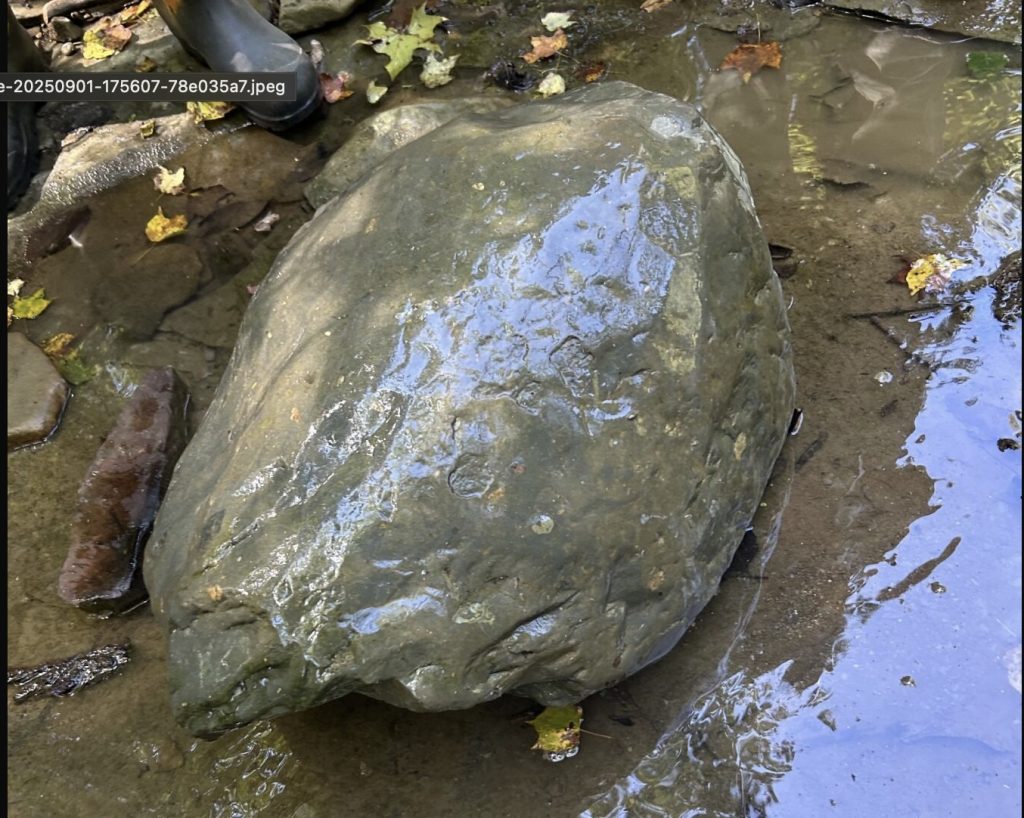
This is a glacial erratic, a non-native rock that was deposited from a glacier. It was deposited from the Huronian ice age from around 2.2-2.5 billion years ago. These are important to study the range of previous glacial events.
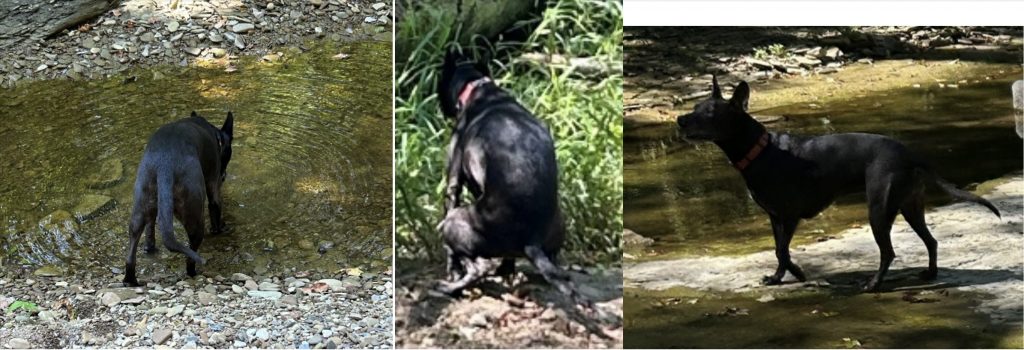
Dr. Lyon and one of her IS students accompanied us to Wooster Memorial Park. Roo (Dr. Lyon’s dog) studied the hydrology diligently with us. Figure on the left shows her sampling the water quality. She fertilizes local flora in middle panel and on the right, Roo uses her canine hearing to pay full attention to the lecture. Roo is a very good hydrologist, and a very, very good girl.
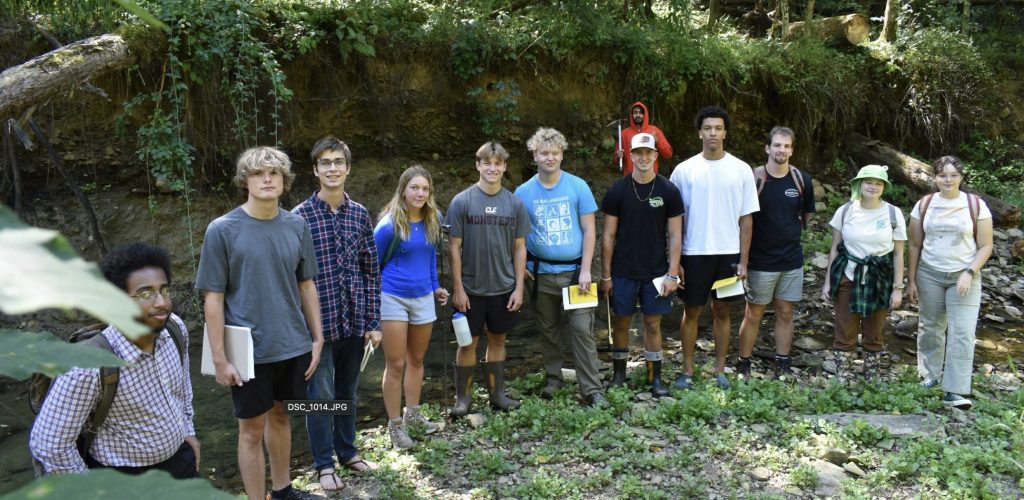
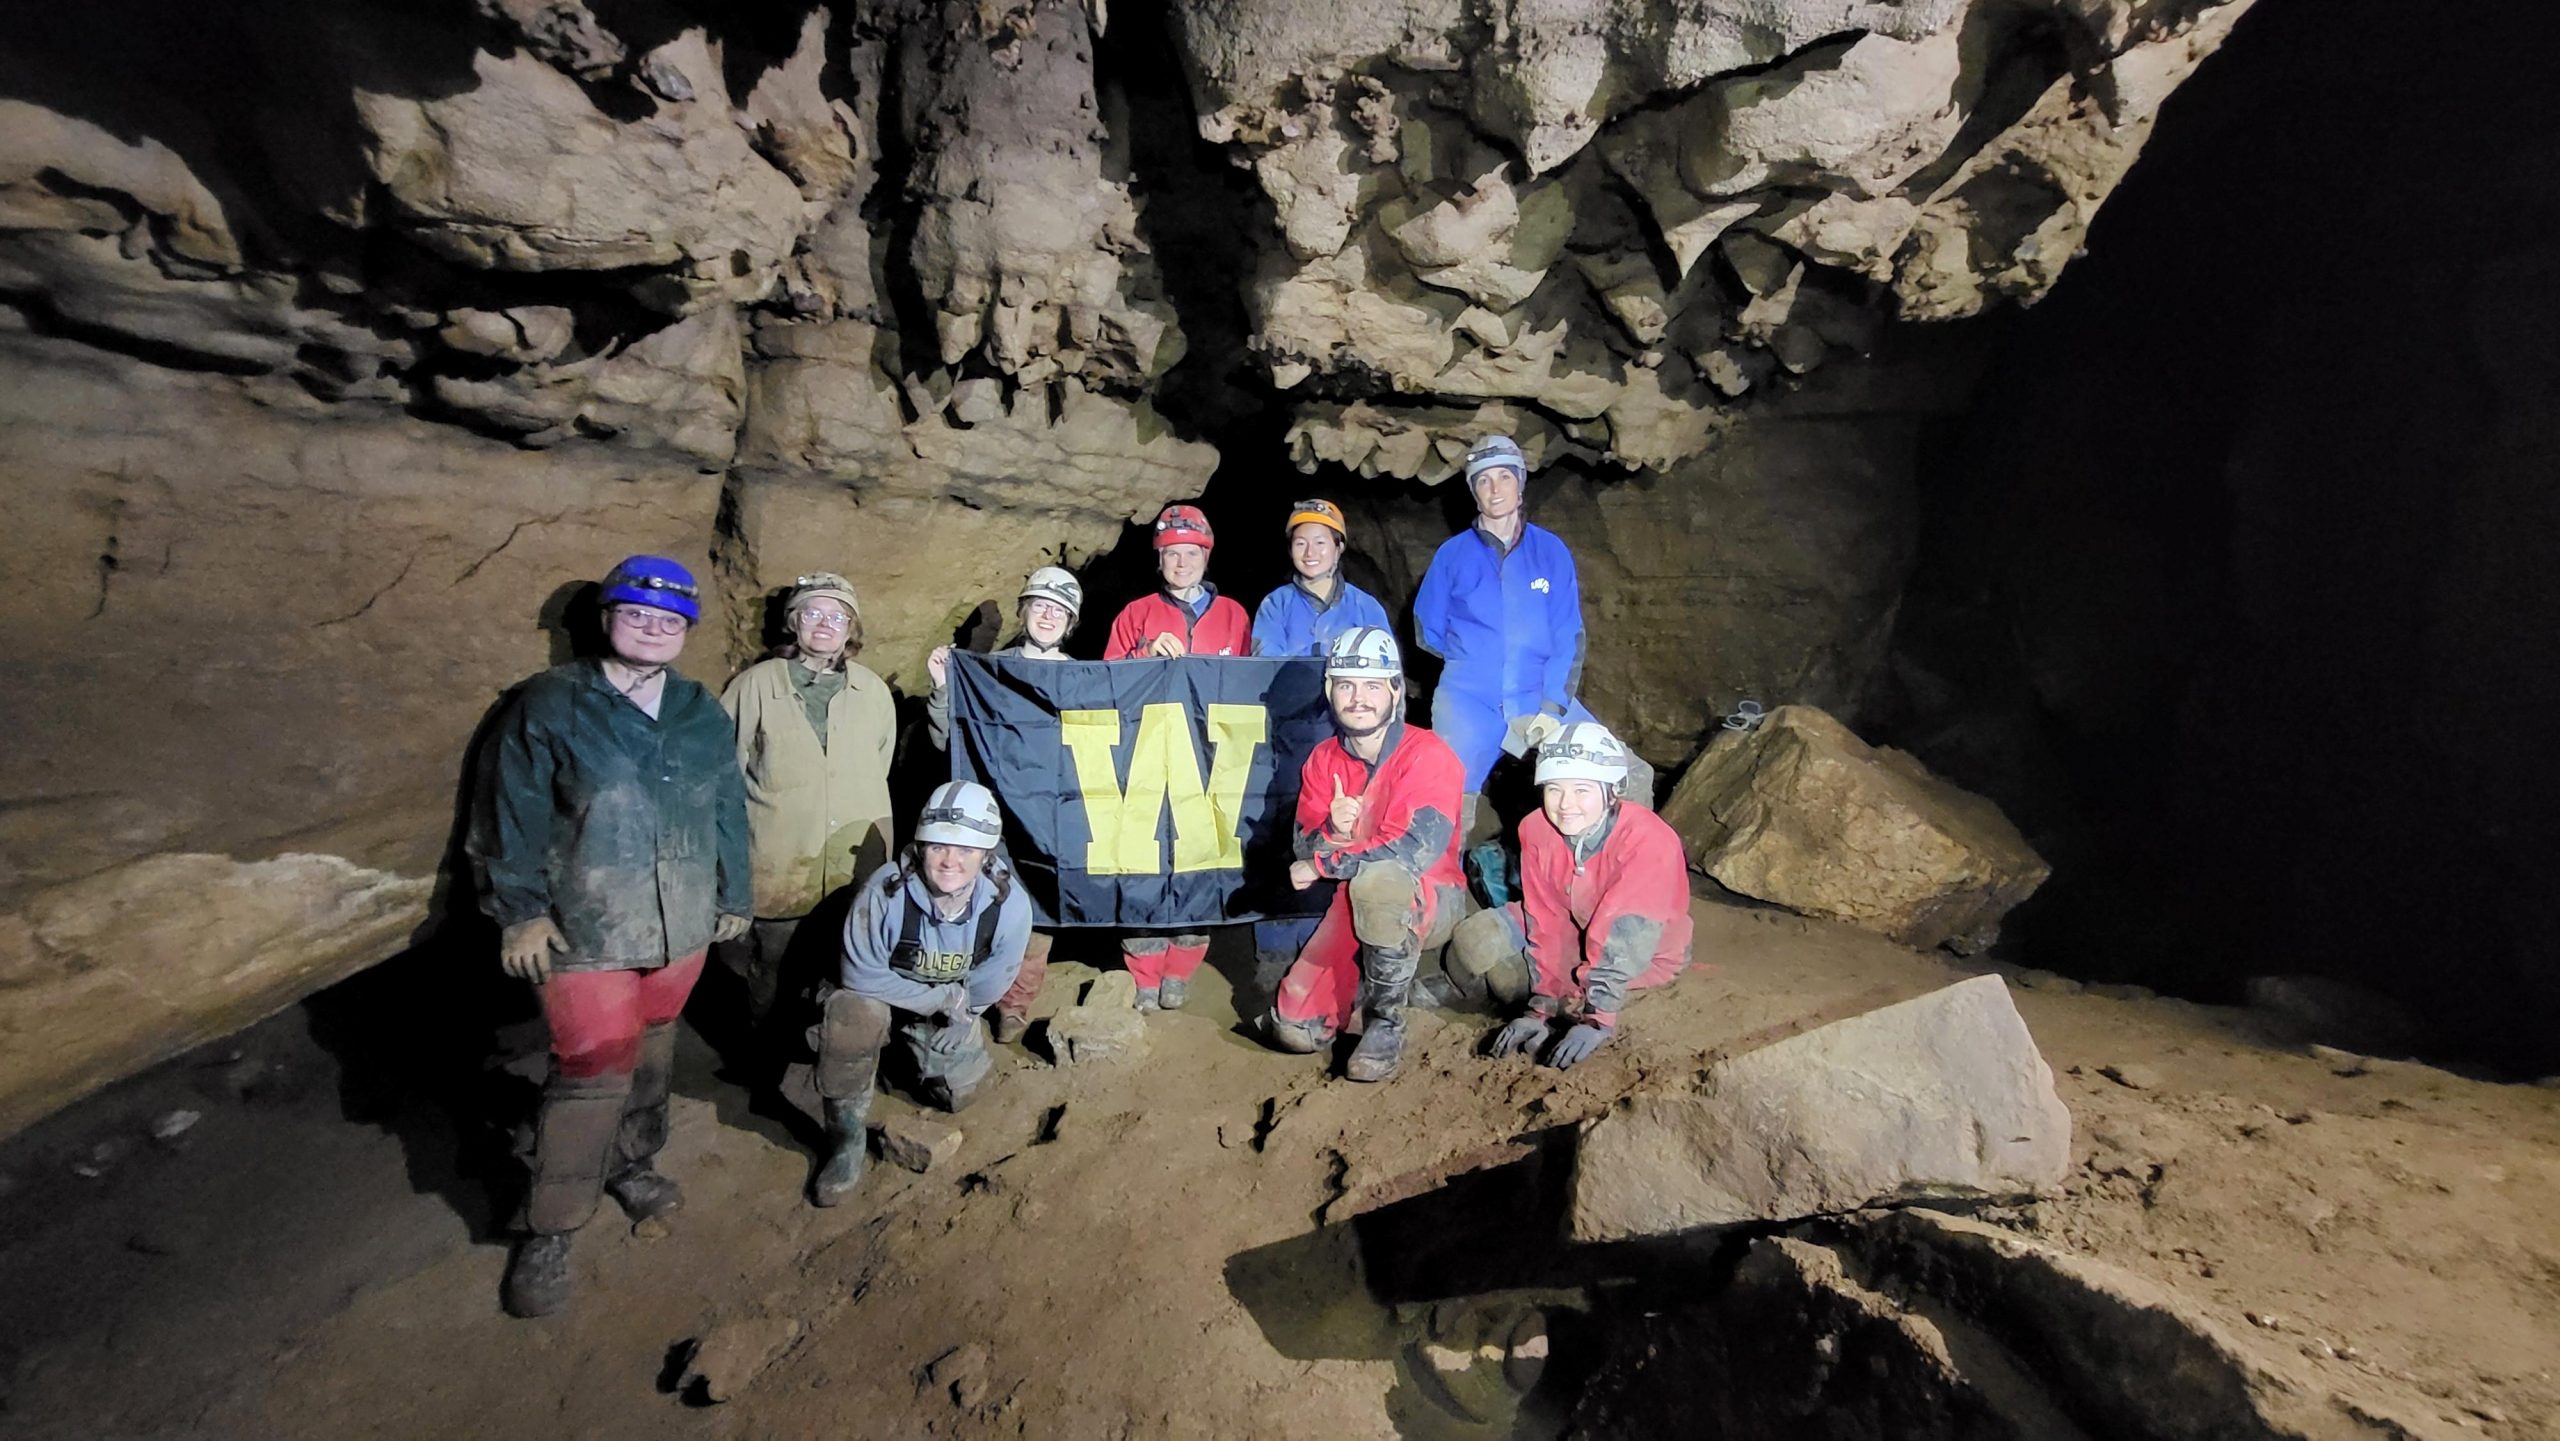
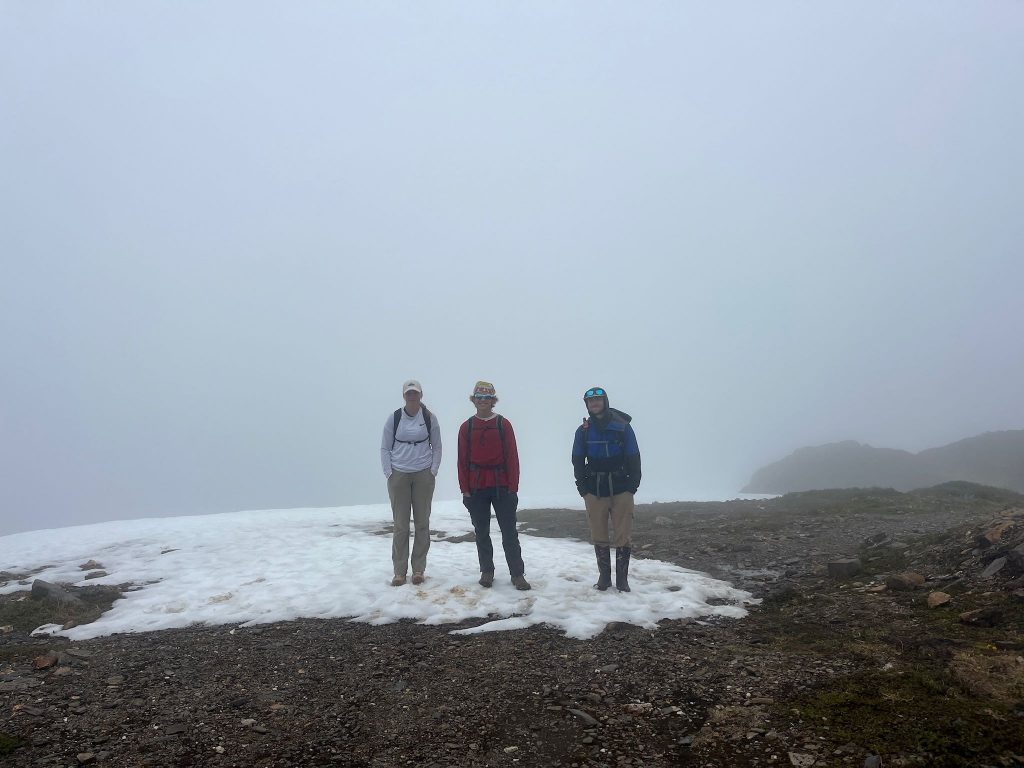
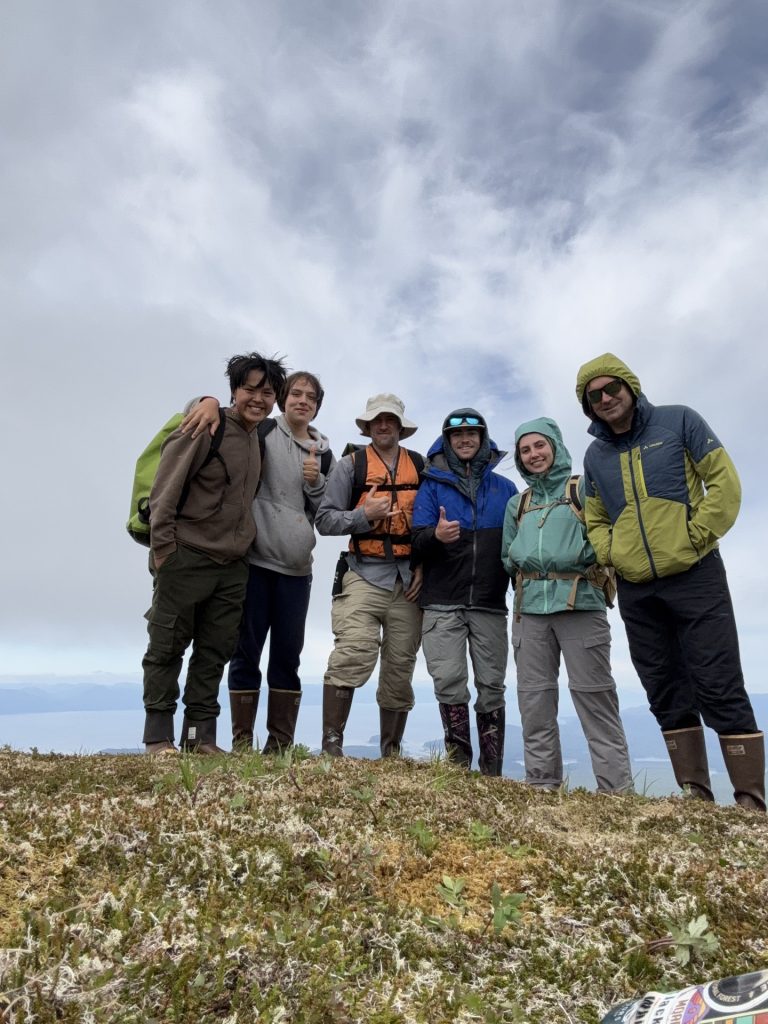
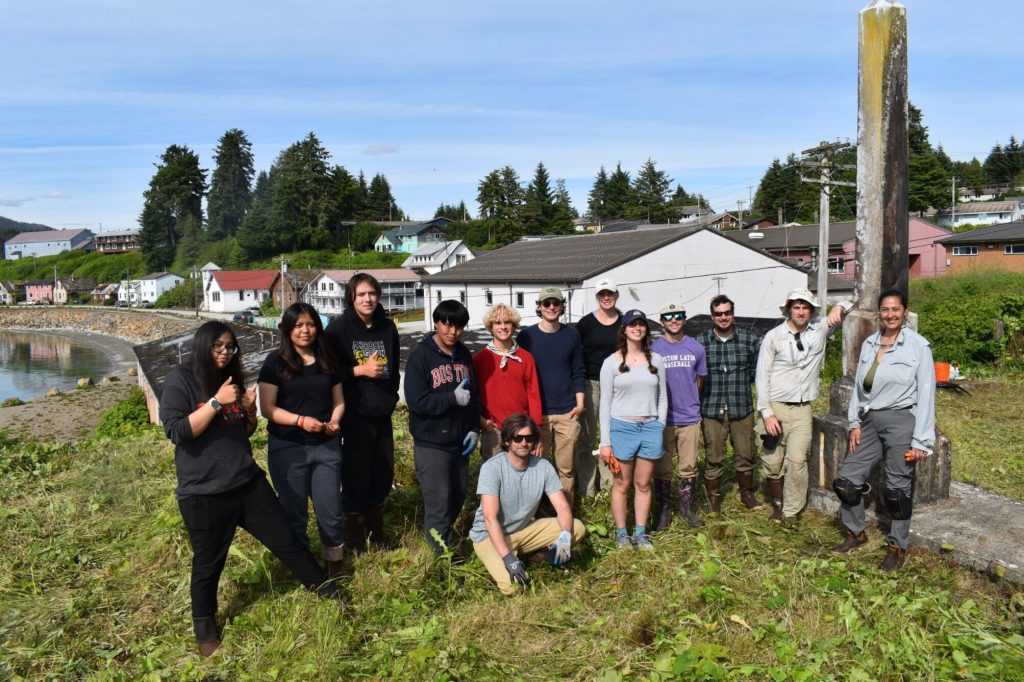
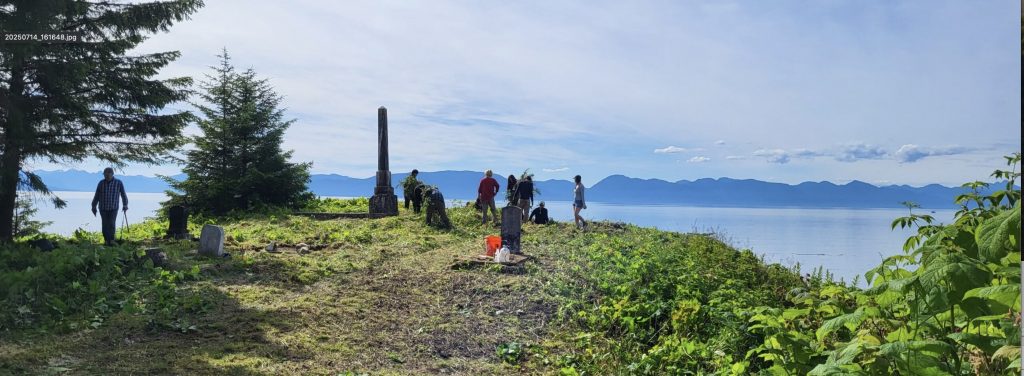
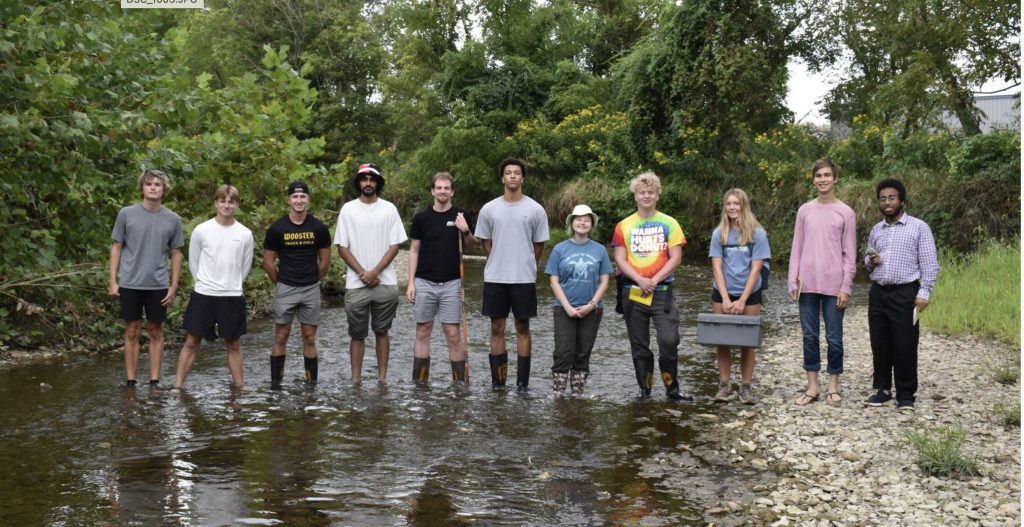
The group at the final stop.
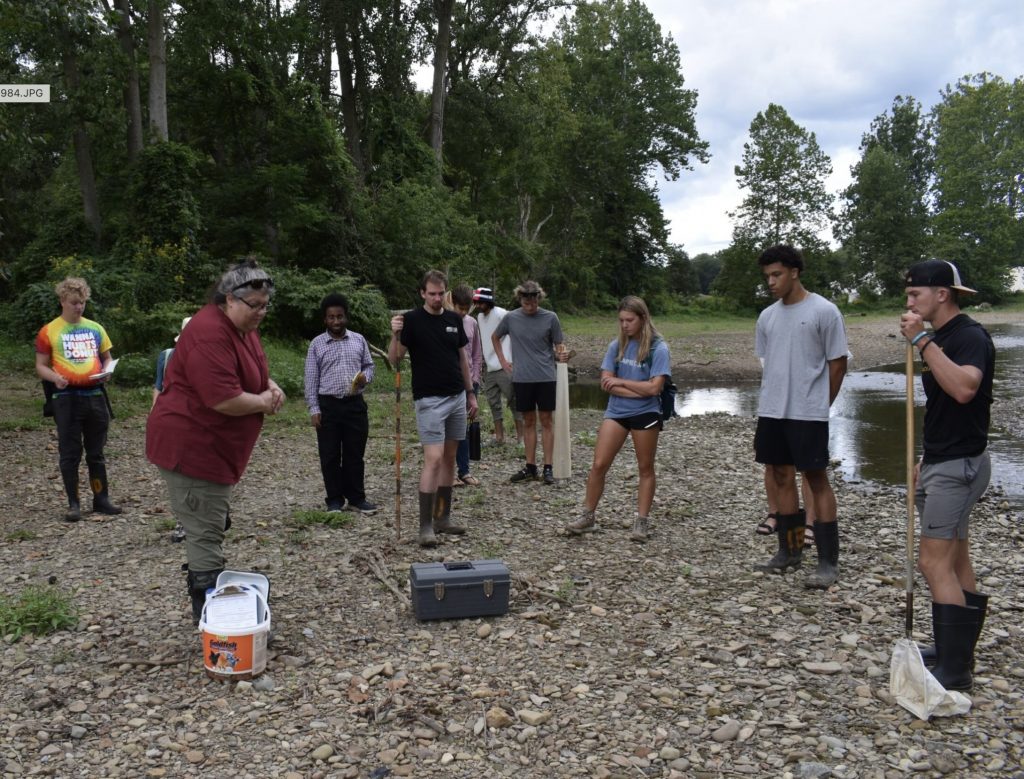
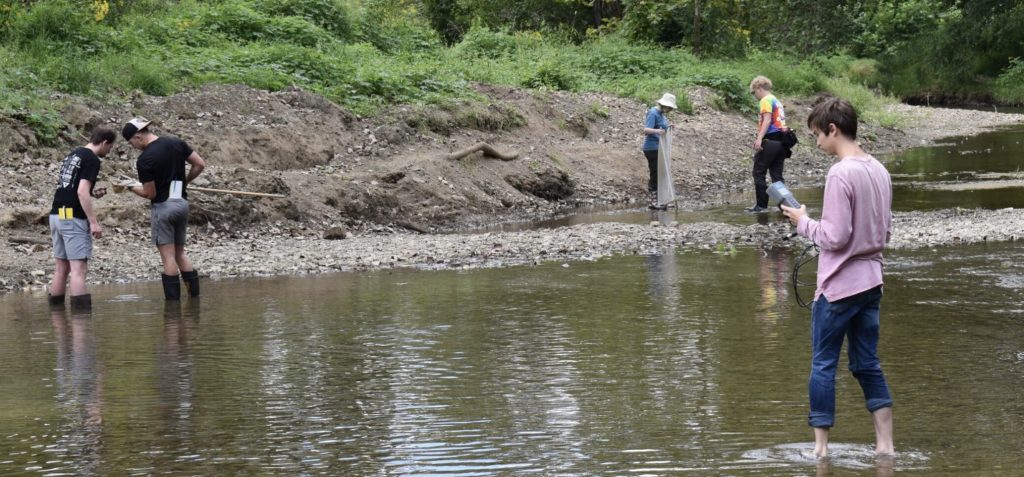
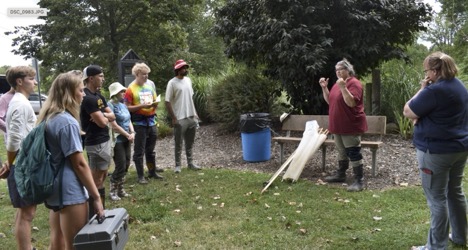
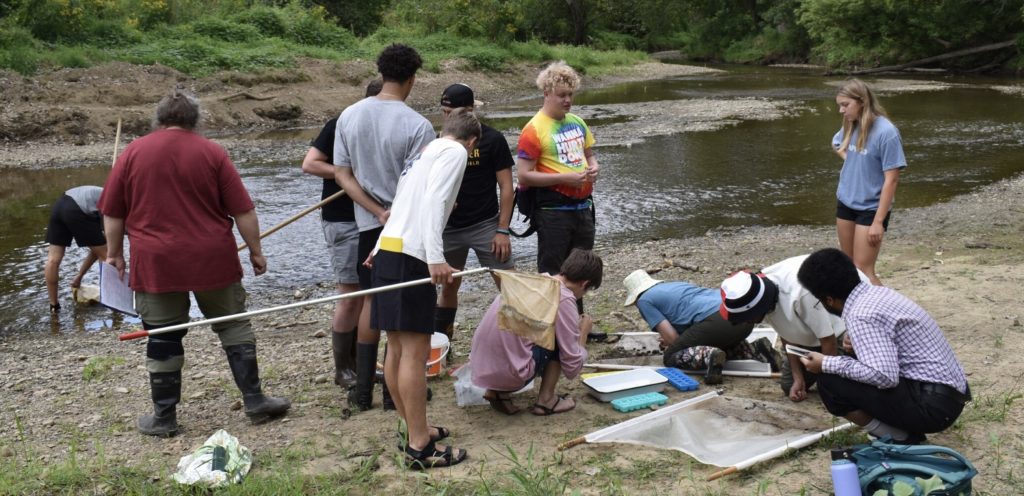 Guest bloggers: Phillipp Drappatz and Elliot Miller, the Hydrology class at the College of Wooster performed a macroinvertebrate survey on 8/25/25 on Apple Creek in Wooster. The first lab of the semester was a trip to Grosjean Park in Wooster. The class was joined by and guided by macroinvertebrate expert Carry Elvie from the CFAES who is also the director of the Bug Zoo. Apple Creek unusually for Ohio is a freestone trout stream under the stewardship of the Clear Fork River chapter of Trout Unlimited, which has been performing surveys since 2012. The purpose of this fieldtrip was to add on the current Trout Unlimited record and to gain insight into the health of the stream based on the assemblage of macroinvertebrates.