Note: The following blog post is by Ben Sershen (’19), who worked with Dr. Crawford on a summer research project.

Source: https://csmphotos.wordpress.com/2013/01/17/bering-sea-opies-and-the-reality-of-the-deadliest-catch/
Intro: My summer research work aimed to further my Junior I.S. in the fields of oceanography and climatology. My research question was: “How well do computer ocean models work for predicting the melt of Arctic sea ice?” This is an important question to ask because many companies are looking to use the Arctic as a shipping passage. To answer this question, I analyzed the data from two models: The Simple Ocean Data reanalysis (SODA) and the Ocean ReAnalysis System 4 (ORAS4), which was produced by the European Center for Medium-Range Weather Forecasts (ECMWF). SODA and ORAS4 are programs that uses physics as well as real-world data, such as from underwater moorings, automated Argo floats, and satellites, to estimate aspects of the oceans such as temperature, water velocity, and salinity. These data could then, in theory, be used to determine when the enough heat has entered the Arctic Ocean to melt sea ice each year.

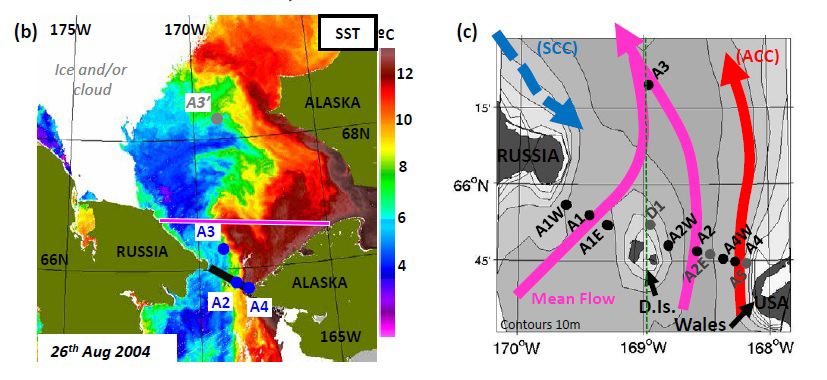
Figure 1: (Left) A map of the Bering Strait with the A3 mooring location labeled. The Chukchi Sea is the area to the north (above) the strait. The magenta line represents the location of my study. (Right) A similar map of the Bering Strait with the Alaskan Coastal Current (ACC) and the Siberian Costal Current (SCC) represented by the red and blue arrows, respectively (Woodgate et al., 2015).
Methods: I focused on the Bering Strait/Chukchi Sea region. This area is important as it is the strait where warm water enters the Arctic, as seen in the second map in figure 1. I calculated how much heat was passing through the Bering Strait, into the Arctic using data from SODA and ORAS4. Once I had done this, I had to compare my results to the data from the A3 mooring. This was done by first performing simple correlations (when the heat flow increases do the mooring temperatures increase?). I then correlated the heat flow values to sea ice data – more specifically, the date of the year when the sea ice concentration in the Chukchi Sea dropped below 30%. As heat flow increases, the ice melts faster, retreating earlier. To be a good predictor of sea ice retreat, the heat flow from the models must show this relationship (a positive correlation between the amount of heat and the rate of ice melt).

Figure 2: An example of a cross-section contour plot through the Bering Strait. The darker red represents more heat traveling through the cross-section at that location. The location of the cross-section is marked by the magenta line on the left map in figure 1.
Results: I found that SODA was only accurate when there were mooring data being fed into it. That meant that SODA would not do a very good job at predicting future ocean heat because it relied heavily on real-world data. I performed the same data analysis of ORAS4 that I had performed on SODA and found that ORAS4 produced data that was closer to the mooring data even when mooring data was not available. The ORAS4 data also had a stronger correlation with the sea ice data. I would guess that this is because the ORAS4 is simply better than the SODA model generating realistic data. The ORAS4 model focused on tropical data to generate data and produced better data than SODA, which had a bit more of an Arctic focus. I think that result goes to show how interconnected the world’s oceans really are if you can make accurate predictions of the temperature of the Arctic Ocean from data produced by a tropical model. Using the monthly heat flow values from ORAS4, I created a heat map to visualize the data (figure 3).

Figure 3: A heat map of heat flow data from ORAS4. The y-axis represents months of the year. Note the warmer values occurring in June-October. This represents the seasonal cycle. The x-axis represents years 1990-2017 which illustrates substantial interannual variability.
References
- ECMWF: https://www.ecmwf.int/
- ORAS4: https://climatedataguide.ucar.edu/climate-data/oras4-ecmwf-ocean-reanalysis-and-derived-ocean-heat-content
- SODA 3: http://www.soda.umd.edu/
- Woodgate, R., Stafford, K., and Prahl, F., 2015, A Synthesis of Year-Round Interdisciplinary Mooring Measurements in the Bering Strait (1990–2014) and the RUSALCA Years (2004–2011): Oceanography, v. 28, p. 46–67, doi: 5670/oceanog.2015.57.


