Posts from Antarctica: Intro to the International Thwaites Glacier Collaboration and the TARSAN project


Greetings from McMurdo Station, Antarctica! For those of you who don’t know me, my name is Karen Alley and I’m a visiting assistant professor in the College of Wooster Department of Earth Sciences. I’m a glaciologist and a remote sensor, which means that I study ice sheets and glaciers mainly using satellite imagery. Most of my work has focused on the interactions between the floating parts of ice sheets, known as ice shelves, and the ocean beneath.

I’m in Antarctica as part of the International Thwaites Glacier Collaboration (ITGC; www.thwaitesglacier.org). Our team is TARSAN (Thwaites and Amundsen Regional Survey and Network). In a couple weeks we’ll be heading out first to the floating tongue of Thwaites Glacier and then to the Dotson Ice Shelf. I should be able to share a few blog posts while I’m at McMurdo, and I might even be able to get some text out from the deep field, if our satellite uplink works. I hope to share with you information about our research and about living and working in Antarctica. If I can’t get posts through from the deep field, I’ll at least be able to share some info when I return in February.

For now, I wanted to provide an introduction to the ITGC and our team’s role in that project.

Let’s start with the big picture. We study the world’s ice sheets and glaciers for many reasons, but one of the most globally important reasons is to understand rates of sea-level rise. Greenland holds about 23 feet of equivalent sea level. That means that if all of the ice in Greenland melted, every ocean in the world would rise 23 feet. I spend my life studying this stuff, and I still have a difficult time imagining those numbers. Just Greenland, a relatively small landmass, has enough ice piled on top to raise every single bit of ocean in the world 23 feet.

Antarctica, on the other hand, holds about 187 feet of equivalent sea level.

Now, that being said, we’re not in any danger of melting all the ice in Greenland and Antarctica, so we’re not worried about 200+ feet of sea-level rise coming anytime soon. However, those very large numbers mean that melting even a small percentage of Greenland and Antarctica has big consequences, since millions of people in the world live within just a few feet of sea level.

So, to understand sea-level rise, we have to understand what the ice sheets are going to do as the world warms. Since the ice sheets are huge, we focus on the parts of the ice sheets that are most likely to change and that hold enough ice to significantly impact global sea-level. Thwaites Glacier is at the top of the list.

Thwaites Glacier, which is the name of a fast-flowing, Florida-sized portion of West Antarctica that dumps a whole lot of ice into the ocean, is arguably the most important glacier in Antarctica. It is thinning, retreating, and increasing ice discharge rapidly, and it holds back much of the ice in West Antarctica. (Antarctica is often divided up into West Antarctica, East Antarctica, and the Antarctic Peninsula. West Antarctica is the piece of the ice sheet that sits deepest below sea level, which makes it most likely to respond to rising ocean temperatures.)

Recent work (e.g. this paper or this one) suggests that Thwaites Glacier isn’t stable. Over the next few hundred years, it is likely to melt back and break apart piece by piece, releasing west Antarctica’s ice and raising sea levels by 10 feet or so. As a scientific community, we need to find out whether it’s true that Thwaites is slowly collapsing, estimate how much and how fast sea-level rise will occur, and constrain the processes leading to this collapse in order to predict how similar patterns might progress in other parts of Antarctica and Greenland. The ITGC is an effort between the US and the UK to answer some of these pressing questions. Eight teams are examining ice flow patterns, sediment cores that tell us the history of the glacier, ocean characteristics, sub-ice-shelf bed topography, grounding-line (where the glacier goes from sitting on land to floating) dynamics, basal melt rates, surface accumulation patterns, computer models predicting the glacier’s future, and more.

Our team is split into two groups. One group is doing ship-based measurements of ocean conditions near Thwaites. The group I’m in will be on the floating part of Thwaites Glacier, and later on the nearby Dotson Ice Shelf. We intend to use seismic surveys to study the ocean and the bed beneath the floating ice shelves, radar to look at details of accumulation and change within the ice itself, and a hot-water drill to drill through the ice shelves and place instruments in the ocean underneath. We want to know more about the details of the interactions between the ice shelves and the ocean beneath, and to pinpoint the circulation patterns that are leading to melting at Thwaites. Much of the relatively warm water reaching the Thwaites grounding line may travel beneath Dotson, so our group and the ship-based group will provide a slightly larger context for understanding changes at Thwaites.

For now we’re completing safety trainings and equipment preparation at McMurdo, and crossing our fingers that weather and logistics hold to allow us to collect plenty of data. I’ll share some info about those trainings and preparations in a later post or two!

Posted in Uncategorized | Tagged , , , | 9 Comments

New paper: Early Silurian recovery of Baltica crinoids following the end-Ordovician extinctions (Llandovery, Estonia)

It has been an absolute delight to work with the crinoid master Bill Ausich of The Ohio State University. He is not only one of the world’s top paleontologists, he’s a great guy. Bill taught me all I know about Paleozoic crinoids and their complex systematics. Last week our latest paper appeared on Silurian crinoids in Estonia, with the perceptive and observant Ursula Toom (Department of Geology, Tallin University of Technology) as our co-author. Here’s the abstract from the Journal of Paleontology

“Three new Llandovery (early Silurian) crinoids from Estonia provide an improved understanding of the paleogeographic aspects of the crinoid diversification following the end-Ordovician extinctions. The new taxa are Euspirocrinus hintsae new species (Rhuddanian eucladid), Oepikicrinus perensae new genus new species (Aeronian camerate), and Rozhnovicrinus isakarae new genus new species (Aeronian eucladid). This brings the total of described Llandovery crinoids in Estonia to eight nominal species and a further three taxa in open nomenclature. The Rhuddanian radiation in Baltica mirrored that on Laurentia and Avalonia and was dominated by Ordovician clades that continued to diversify during the Silurian. Known Aeronian crinoids from Estonia continue these clades, whereas new clades diversified on Laurentia and Avalonia. However, by the Wenlock, a largely cosmopolitan fauna existed on Laurentia, Avalonia, and Baltica.”

Bill and I visited Estonia in the summer of 2018 to do this work, which took place primarily in Tartu and Tallin. We had a wonderful time with our Estonian friends. This particular project involved the description of new Silurian crinoids to help plot crinoid recovery and diversification after the end-Ordovician mass extinctions.

One of the new crinoids is shown above. It is Oepikicrinus perensae n. gen. n. sp., a new eucamerate from the Llandovery. The genus is named after Armin Öpik (1898–1983), an epic Estonian paleontologist. The species name recognizes Helle Perens, an expert Estonia geologist. The figure particulars: (1) lateral view of two paratypes, TUG 999-1-1 and 999-1-2; (2) lateral view of partially disarticulated paratype GIT 405-254-3; (3) lateral view of holotype GIT 405-254-1, with complete arms, also note long pinnules; (4) lateral view of compacted paratype GIT 405-254-2, with proximal arms. Scale bars = 1.0 mm (2); 2.5 mm (1, 3, 4).

The above plate shows the other two new crinoids. Rozhnovicrinus isakarae n. gen. n. sp., a new eucladid, is named after the prominent Russian paleontologist Sergei V. Rohznov and our Estonian friend and paleontological colleague Mare Isakar. Euspirocrinus hintsae n. sp., another new eucladid, is named for Linda Hints, an Estonian paleontologist who found the best specimen. The figure details: Rozhnovicrinus isakarae n. gen. n. sp.: (1) crown with damaged aboral cup, paratype TUG 1329-14-1; (2) two specimens, the larger with only an impression of the aboral cup is paratype GIT 405-252-1, and the smaller complete specimen is holotype GIT 405-252-2; (3) D-ray lateral view of aboral cup of paratype GIT 405-252-1; (4) enlargement of holotype GIT 405-252-2 and arms of paratype GIT 405-252-1 (see Fig. 5.2); (5, 6) paratype TUG 1329-14-4: (5) aboral cup and proximal arms; (6) enlargement of aboral cup; (7) Euspirocrinus hintsae n. sp., holotype GIT 405-256, note distal coiling of arms. Scale bars = 2.5 mm (1, 3–6); 5.0 mm (2, 7).

This all looks very esoteric when I write these highlights, but it was a challenging and fun project. This work is an example of systematics used to address paleoecological, evolutionary and biogeographic questions. It also represents the continuing work of a diverse, international team.

My colleagues Bill Ausich and Ursula Toom in Tallin, Estonia (summer 2018).

Reference:

Ausich, W.I., Wilson, M.A., & Toom, U. 2020. Early Silurian recovery of Baltica crinoids following the end-Ordovician extinctions (Llandovery, Estonia). Journal of Paleontology, DOI: https://doi.org/10.1017/jpa.2019.89

Posted in Uncategorized | Tagged , , | 5 Comments

Wooster Records Wettest Year on Record

Last year around this time, I reported on this blog that Wooster had just completed its third wettest year on record. A year later, the “wettest year” record has been broken. With continuous record-keeping beginning in 1900 at the OARDC weather station, the 1901 water year (Oct 1900 through Sep 1901) is the first full year, and 2019 is the 119th year on record. Amazingly, this was the wettest year ever recorded for Wooster. Here is an updated graph of the annual precipitation in Wooster with “line of best fit” and a more detailed curve. The black dot at the end of the time series is water year 2019. At 56.3 inches, it beat out the previous record of 51.0 inches set in 2004 by 6% — a large margin! Note that although, there has been a long-term increase in annual precipitation at Wooster, this year was so far above the trend line that it’s likely we’ll drop back down to around 42 inches next year.

The reason for this record was primarily because of an exceptionally wet period from May through August, peaking with a July in which we experienced about twice as much precipitation as normal. Late spring to early summer is usually our wetter season, but this year the summer storms were dramatic. However, as shown in the plot below, every month except September yielded above-average precipitation. (The green bars are the total precipitation in 2019 for each month; the blue dots are the average, and the black whiskers are the standard deviation.) In fact, the record was broken in August!

Finally, it’s worth noting that the maximum daily precipitation was 4.22 inches recorded July 22. That ranks 5th highest all-time in Wooster for daily precipitation. Only two days have ever had over 5 inches — September 14, 1979 and the infamous flood of July 5, 1969. (Note, because of when precipitation is recorded, much of the precipitation really fell on the 21st, 13th, and 4th, respectively.)

Posted in Uncategorized | Tagged , , , | 7 Comments

A new paper on the future of Antarctica’s Ice Shelves

Our group published a new paper today in Science Advances, which suggests that ice-flow models that predict future sea-level rise are missing an important process: Basal channels, which are “upside-down rivers” of buoyant water flowing along the undersides of ice shelves, have formed at the margins of some of Antarctica’s most important ice streams. For example, Pine Island Glacier, shown below in a 2007 NASA MODIS satellite image, has basal channels beneath both of its weak “shear-margins” (red dashed lines). We know warm water is flowing through these channels because they create open-water areas, called “polynyas,” at the ice-shelf edge. These channels are weakening the weakest areas of fast-flowing ice streams, making them more susceptible to ocean-driven break-up.

Check out Wooster’s press release here: https://news.wooster.edu/news/2019/10/wooster-professor-is-lead-author-in-new-study-on-antarctic-conditions-that-are-causing-sea-level-rise/

The full article is open-access and can be downloaded from Science Advances: https://advances.sciencemag.org/content/advances/5/10/eaax2215.full.pdf

Posted in Uncategorized | Tagged , | Leave a comment

A new paper on a cryptic crustoid graptolite from the Middle Ordovician of Estonia

I have long enjoyed exploring the Ordovician and Silurian rocks of Estonia with my Estonian friend Olev Vinn. We have done a lot of work together, and Estonia continues to provide fascinating fossils for our studies. Our circle of paleontologists has expanded continually over the years in Estonia, including other Estonians, Brits and Americans (along with many Wooster students — search “Estonia” in this blog).

This latest paper, Vinn et al. (2019), is from a project Olev, Ursula Toom, and I pursued with a single specimen from the Middle Ordovician (Darriwilian) of Estonia. It analyzes the unusual preservation of crustoid graptolite (rather rare in its own right) preserved inside the gloomy hollow of a nautiloid shell (its conch). Here is the abstract:

“A light grey nautiloid conch has a dark brown colony attached to its internal surface. This colonial fossil resembles hederellids and bryozoans, but is in fact a crustoid graptolite (Hormograptus? sp.). The colony has been lithoimmured inside this nautiloid conch by early cementation. Crustoid graptolites were a part of the encrusting communities in the Middle Ordovician of Baltica, but their abundance among encrusters of biogenic substrates reached a peak in the middle Sandbian. The cryptic mode of life appeared very early in the evolution of the crustoids. The discovery of this crustoid graptolite in a nautiloid conch indicates that the Baltic Middle Ordovician cryptic communities were taxonomically more diverse than was known previously. The nautiloid conch studied is sparsely encrusted with an encrustation density that is similar to those of other Middle Ordovician cryptic surfaces described from Estonia.”

From figure 2: Hormograptid graptolites from the Ordovician of Estonia. A–C. Hormograptus? sp., attached to the internal surface of a nautiloid conch; Harku Quarry, Kunda Regional Stage (lowermost Darriwilian) (GIT 494-41-1). [Image C is at the top of this post.]

The unusual taphonomic pathway of this specimen was through lithoimmuration, in which early calcite cement essentially entombed the crustoid graptolite colony against the internal nautiloid shell surface. That shell was made of aragonite which quickly dissolved, leaving the base of the graptolite exposed for us. That was enough to make the identification and show a bit of cryptic niche space occupied in the Middle Ordovician.

Reference:

Vinn, O., Wilson, M.A. & Toom, U., 2019. A crustoid graptolite lithoimmured inside a Middle Ordovician nautiloid conch from northern Estonia. Annales Societatis Geologorum Poloniae, 89: doi: https://doi.org/10.14241/asgp.2019.17

Posted in Uncategorized | Tagged , , | 1 Comment

Wooster Geologists at the 2019 Annual Meeting of the Geological Society of America

Phoenix, Arizona — It was a small group of Wooster Geologists at the annual meeting of the GSA held in Phoenix last week. The very early date (about a month earlier than usual) and the consequently earlier abstract deadline reduced attendance overall, especially for those geologists who needed the summer to collect data (most of our Independent Study students). Wooster had only one student at the conference: the happy Evan Shadbolt (’20) pictured above. Evan and I presented a poster on research by Team Jurassic Utah. Since we did the fieldwork in March 2019, we could get our abstract completed by the early deadline.

Dr. Greg Wiles gave an oral presentation on Holocene Alpine glaciation in southern coastal Alaska with a group of Wooster student and staff co-authors representing the Wooster Tree Ring Lab.

I was very proud to be part of a poster presentation on the Middle Jurassic of Israel by Yael Leshno Afriat, a graduate student at Hebrew University in Jerusalem. It was a delight to see Yael again, and her poster brought back great memories of fieldwork in the Negev.

The GSA annual meeting is where the Paleontological Society has its own annual meeting. This year long-time friend of Wooster Geology Dr. Paul Taylor was awarded a Fellowship of the society. Richly deserved. Search this blog for “Paul Taylor” and you’ll see how important he has been to us for decades.

The annual Wooster alumni gathering was, like every other event at this meeting, unusually under-populated. Nevertheless it was a great group, and there were alumni there we hadn’t seen at this meeting before. The photograph is of those present at our traditional 8:00 pm Monday picture time. There were several other Wooster geologists at the meeting who could not make it to the event at this time.

Next year in Montréal! This meeting will have more reasonable dates: October 25-28, 2020.

Posted in Uncategorized | Tagged , , | 1 Comment

New Publications from the Tree Ring Lab

Four new studies from the Wooster Tree Ring Lab have recently appeared in Ecology, Journal of Geophysical Research – Biosciences, The Holocene and Chemosphere.

Brian Buma lead the study published in Ecology that described the results of revisiting a classic ecological succession site in Glacier Bay National Park and Preserve. The article is titled100 years of primary succession highlights stochasticity and competition driving community establishment and stabilityWe blogged about some of the fieldwork for this study a few years ago here.

Abstract: The study of community succession is one of the oldest pursuits in ecology. Challenges remain in terms of evaluating the predictability of succession and the reliability of the chronosequence methods typically used to study community development. The research of William S. Cooper in Glacier Bay National Park is an early and well‐known example of successional ecology that provides a long‐term observational dataset to test hypotheses derived from space‐for‐time substitutions. It also provides a unique opportunity to explore the importance of historical contingencies and as an example of a revitalized historical study system. We test the textbook successional trajectory in Glacier Bay and evaluate long‐term plant community development via primary succession through extensive fieldwork, remote sensing, dendrochronological methods, and newly discovered data that fills in data gaps (1940’s to late 1980’s) in continuous measurement over 100+ years. To date, Cooper’s quadrats do not support the classic facilitation model of succession in which a sequence of species interacts to form predictable successional trajectories. Rather, stochastic early community assembly and subsequent inhibition have dominated; most species arrived shortly after deglaciation and have remained stable for 50+ years. Chronosequence studies assuming prior composition are thus questionable, as no predictable species sequence or timeline was observed. This underscores the significance of assumptions about early conditions in chronosequences and the need to defend such assumptions. Furthermore, this work brings a classic study system in ecology up to date via a plot size expansion, new baseline biogeochemical data, and spatial mapping for future researchers for its second century of observation.

Photo taken in the West Arm of Glacier Bay close to where the Cooper plots were “rediscovered”.


Dr. Ben Gaglioti (University of Alaska – Fairbanks)  just lead another innovative study. This time Ben has assembled a time series of traumatic resin ducts (TRDs) in mountain hemlock that  is a record of past winter conditions and the strength of the Aleutian Low. The article appeared in the Journal of Geophysical Research: Biogeosciences.

The study included tree-ring records from four wild outer coast sites along the the Gulf of Alaska. This is the first work to use these TRD features in tree-rings as a proxy for winter storminess.

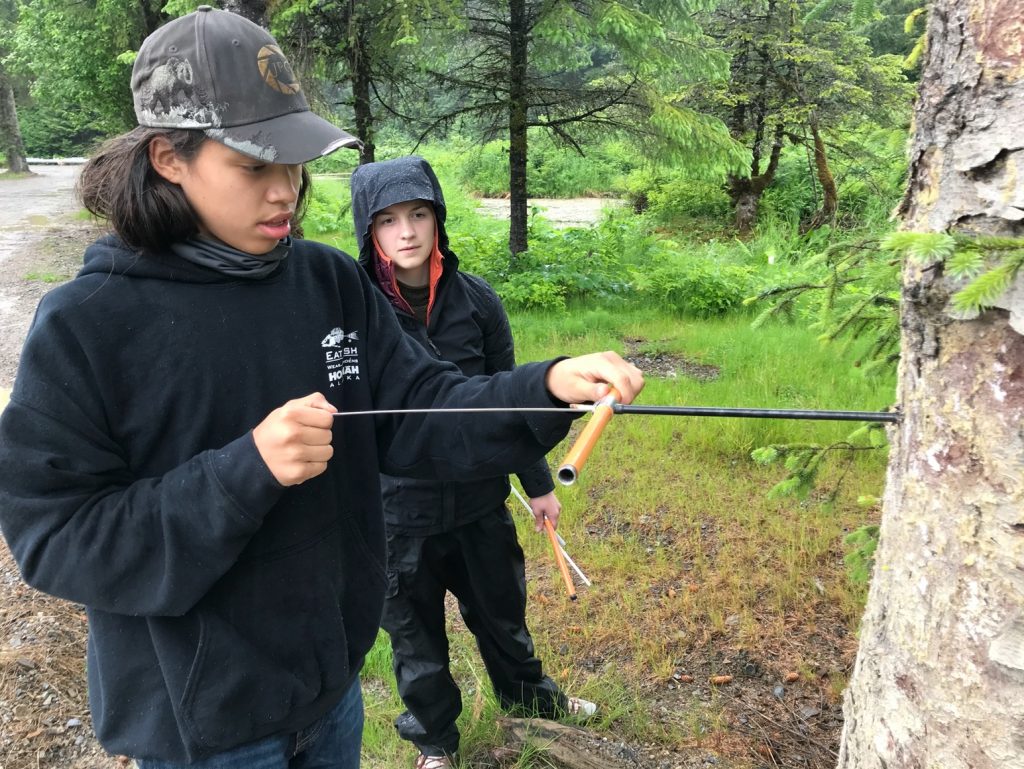
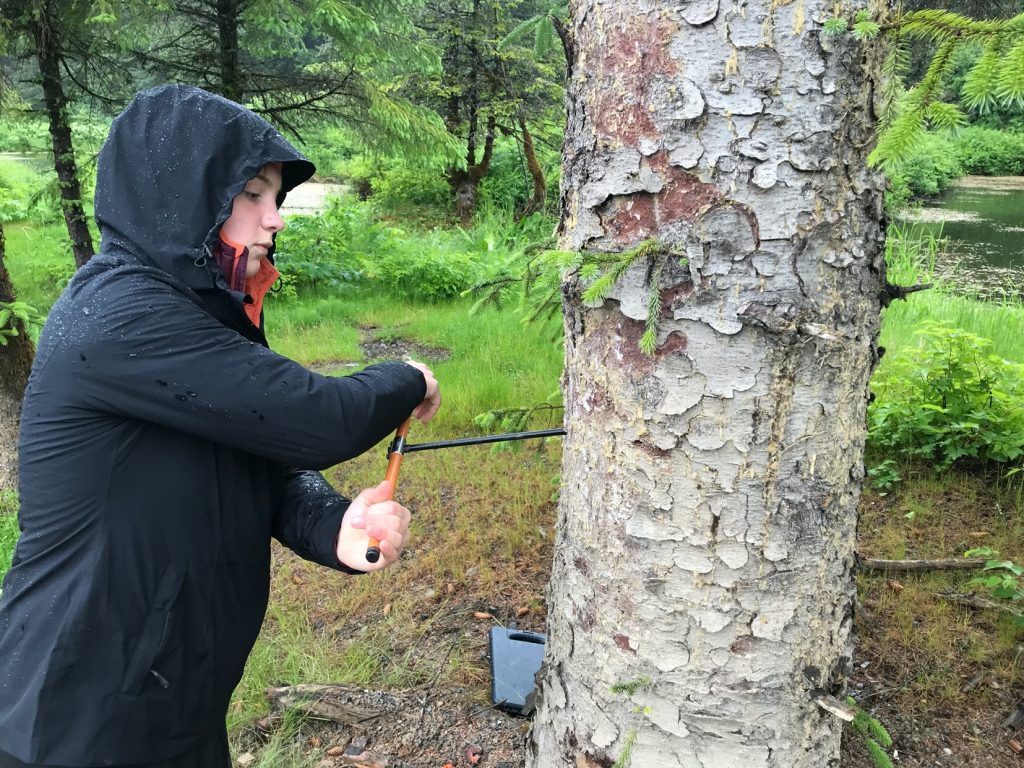
a – The clearly-stressed trees used in this study. b – Careful observations and measurements from increment cores were taken to work out the timing of maximum wind stress and storminess. c, d –  Examples of Traumatic Resin Ducts in the tree rings.

Once assembled, the decadal variability of the winter time record was clearly related to the Pacific Decadal Oscillation (see below). This new record is the first of its kind and gives us a new record of wintertime variability from the North Pacific.

Figure above shows a frequency diagram TRDs compared with indices of winter Pacific decadal variability. The records compare favorably giving us confidence in this new proxy technique and Ben’s interpretations.

Ben used some new sites and some from  the archives of the Wooster Tree Ring Lab as part of this study and his new technique is one that the Wooster lab can adopt and learn as we continue to analyze new collections and re-analyze our past collections.


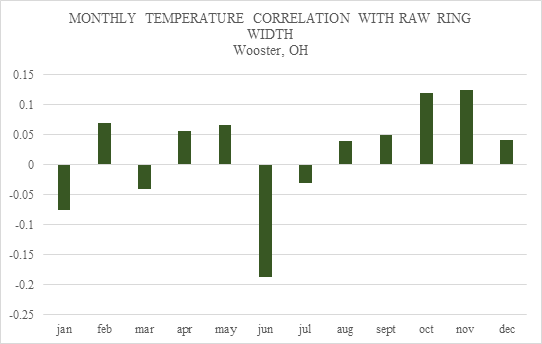
Rob Wilson (University of St. Andrews) lead a study from the Yukon. He used blue intensity tree-ring records from white spruce to improve dendroclimatic temperature reconstructions from the southern Yukon.

The study is titled: Improved dendroclimatic calibration using blue intensity in the southern Yukon. and the abstract reads like this: In north-western North America, the so-called divergence problem (DP) is expressed in tree ring width (RW) as an unstable temperature signal in recent decades. Maximum latewood density (MXD), from the same region, shows minimal evidence of DP. While MXD is a superior proxy for summer temperatures, there are very few long MXD records from North America. Latewood blue intensity (LWB) measures similar wood properties as MXD, expresses a similar climate response, is much cheaper to generate and thereby could provide the means to profoundly expand the extant network of temperature sensitive tree-ring (TR) chronologies in North America. In this study, LWB is measured from 17 white spruce sites (Picea glauca) in south-western Yukon to test whether LWB is immune to the temporal calibration instabilities observed in RW. A number of detrending methodologies are examined. The strongest calibration results for both RW and LWB are consistently returned using age-dependent spline (ADS) detrending within the signal-free (SF) framework. RW data calibrate best with June–July maximum temperatures (Tmax), explaining up to 28% variance, but all models fail validation and residual analysis. In comparison, LWB calibrates strongly (explaining 43–51% of May–August Tmax) and validates well. The reconstruction extends to 1337 CE, but uncertainties increase substantially before the early 17th century because of low replication. RW-, MXD- and LWB-based summer temperature reconstructions from the Gulf of Alaska, the Wrangell Mountains and Northern Alaska display good agreement at multi-decadal and higher frequencies, but the Yukon LWB reconstruction appears potentially limited in its expression of centennial-scale variation. While LWB improves dendroclimatic calibration, future work must focus on suitably preserved sub-fossil material to increase replication prior to 1650 CE.

The Figure above shows the location of the Yukon study site and includes various other sites the Wooster lab has worked on in Alaska. Rob has been a great help in the efforts at the Wooster Tree Ring Lab facilitating our lab’s ability to perform these analyses.


Mary Garvin (Biology, Oberlin College) lead the study using tree-rings and chemical analyses entitled: A survey of trace metal burdens in increment cores from eastern cottonwood (Populus deltoides) across a childhood cancer cluster, Sandusky County, OH, USA.  

Abstract: A dendrochemical study of cottonwood trees (Populus deltoides) was conducted across a childhood cancer cluster in eastern Sandusky County (Ohio, USA). The justification for this study was that no satisfactory explanation has yet been put forward, despite extensive local surveys of aerosols, groundwater, and soil. Concentrations of eight trace metals were measured by ICP-MS in microwave-digested 5-year sections of increment cores, collected during 2012 and 2013. To determine whether the onset of the first cancer cases could be connected to an emergence of any of these contaminants, cores spanning the period 1970–2009 were taken from 51 trees of similar age, inside the cluster and in a control area to the west. The abundance of metals in cottonwood tree annual rings served as a proxy for their long-term, low-level accumulation from the same sources whereby exposure of the children may have occurred. A spatial analysis of cumulative metal burdens (lifetime accumulation in the tree) was performed to search for significant ‘hotspots’, employing a scan statistic with a mask of variable radius and center. For Cd, Cr, and Ni, circular hotspots were found that nearly coincide with the cancer cluster and are similar in size. No hotspots were found for Co, Cu, and Pb, while As and V were largely below method detection limits. Whereas our results do not implicate exposure to metals as a causative factor, we conclude that, after 1970, cottonwood trees have accumulated more Cd, Cr, and Ni, inside the childhood cancer cluster than elsewhere in Sandusky County.

Figure – shows the extent of the cancer cluster that coincides with more accumulated Cd, Cr and Ni in the tree-rings.

Posted in Uncategorized | 2 Comments

Drought in Zimbabwe and Other Climate Woes

One of my colleagues shared this article from Truthout with me because the title was about how Alaska has no sea ice within 150 miles of its coastline for the first time in recorded history of Alaskan sea ice. That’s another checkpoint in the decline of summer sea ice, for sure, but the article included many signs of global warming changing our climate and impacting animals and people. One of the litany of climate woes they cite was a drought in Zimbabwe.  In July this year, the Zimbabwean government declared an emergency because taps were running dry in the capital of Harare and water levels were so low that hydroelectric power ceased, causing widespread blackouts.

The city of Harare reported producing 450 million liters of water per day for 4.5 million people — so 100 liters per day per person on average. (The above article, though, cites cynical estimates that the real number is 1/4 of that.) To put this in perspective, Americans average over 300 liters of water per day.  In 2018, Cape Town, South Africa barely avoided “Day Zero” during their own drought. “Day Zero” was the day that municipal taps would be turned off and residents would receive a ration of 25 liters or water per day.  They prevented that level by millions reducing use to about 50 liters per day for a prolonged period. Cape Town sounds worse, then, even without reaching Day Zero.

Figure 1: Screenshot of Google Maps showing Zimbabwe in Southern Africa.

Two interesting ripples in this story, though:

First, the socioeconomic and political situation in Zimbabwe is less stable than in South Africa. Long-time despotic leader Robert Mugabe died on September 6, 2019. News outlets in the USA as diverse as Fox News and Vox have maligned him as a brutal dictator who oppressed his country and brought economic ruin. Before his death, reports of protests in the streets by those opposed to the regime (an especially the economic turmoil) trickled through Western media outlets (examples at the Guardian and NPR). This turmoil clearly goes beyond one drought, and the acuteness with which the drought is impacting Zimbabweans may have more to do with social vulnerability than physical hazard.

Second, is this really about climate change? Every news outlet I’ve read seems to have no problem attributing the drought to climate change despite providing no evidence that this drought is unprecedented or part of a larger pattern. There is evidence that droughts have become more common in parts of the world, such as the Mediterranean (see this NY Times article), but not everywhere. The answer for Southern Africa is: maybe. According to a study in the journal Natural Hazards, droughts in Southern Africa became more severe over the the course of the 20th century, in part because of long term global warming. However, using a combination of evidence from observational studies, the latest report from the Intergovernmental Panel on Climate Change (IPCC) did not find significant increases in the annual maximum in the number of consecutive dry days in Southern Africa.

    Figure 2: Trends in the maximum number of consecutive dry days each year (CDD) 1951 -2010. The plus signs indicate significant trends.


Posted in Uncategorized | Tagged , , , , | 4 Comments

Thirty-third annual report of the Wooster Earth Sciences Department now available

Thank you to Patrice Reeder for her epic work on this report, from its design and art to content. Click away and enjoy!

Posted in Uncategorized | Tagged | Leave a comment

Geomorphology – A Walk in the Park

The class stands in front of one of the unconformities in Wooster Memorial Park (aka Spangler). There was some discussion if this is a disconformity (yes) or a nonconformity (maybe yes). The lodgment till at the base is overlain by a fluvial gravel. The high relief of the contact is due to high mineralization – iron, manganese and other oxides; interestingly, many of the clasts were coated with over a centimeter-thick rind.

Two class members (in the distance) work on the fluvial sediments sitting on top of the Mississippian bedrock. This is the Great Unconformity in the Spangler Gorge. The Fluvial sediments are capped with mill pond (legacy) sediments. Others drill in stainless steel erosion pins into the bedrock channel. Morgan in the foreground points one of the pins out.

Evan examines a debris flow that moved into the fluvial point bars sediments. He found organics in the flow and we have sampled and sent wood samples out for radiocarbon analysis. Results are pending, but they will give us information on the geologic evolution of the gorge.

The Schmidt Hammer is being used to measure  rock strength. Several measurements of the bedrock will be taken to “map out” the relative rock strength of the gorge floor (bedrock stream).

Posted in Uncategorized | 2 Comments