


Guest Bloggers: Evie Sanford and Peter Rothstein – On June 11, the 2024 Scovel Summer Research Team visited Apple Creek with Trout Unlimited to analyze the water quality through a macroinvertebrate survey. This study was performed because macroinvertebrates are often used as biological indicators of stream quality due to their response to pollution. Special thanks to Carrie Elvey from OSU CFAES for teaching us about the area, the method, and what it all means for conservation efforts.
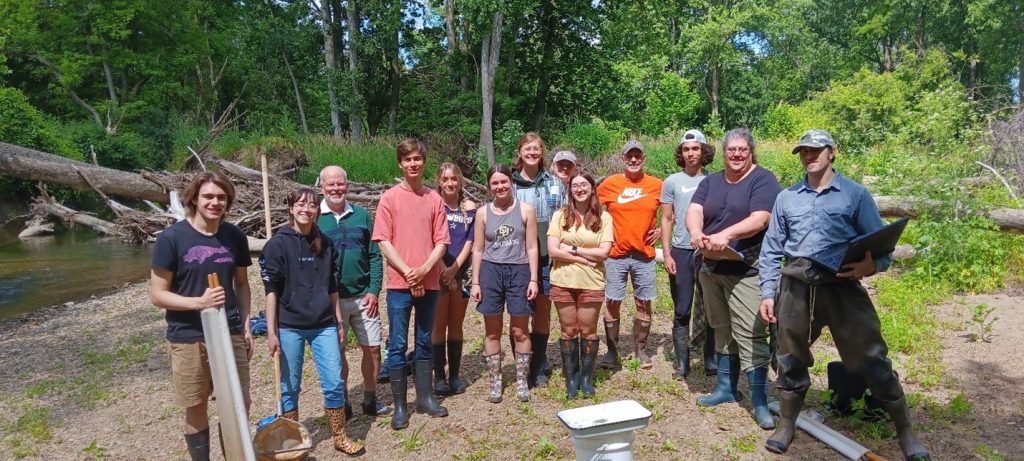
Our 2024 collection team!
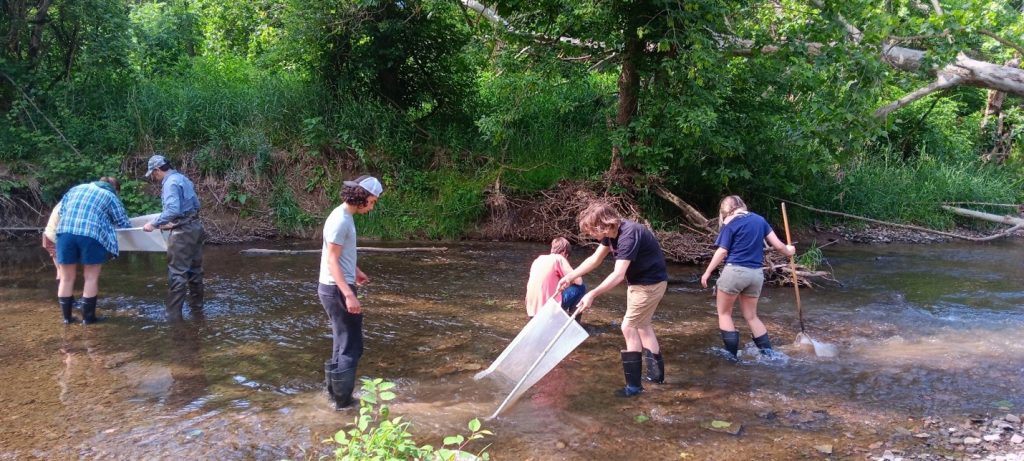
The team used the kick seine method and dip nets to collect macroinvertebrates from the stream.
In addition to nets, we flipped over rocks to find organisms like leeches, water pennies, and macroinvertebrate larvae.
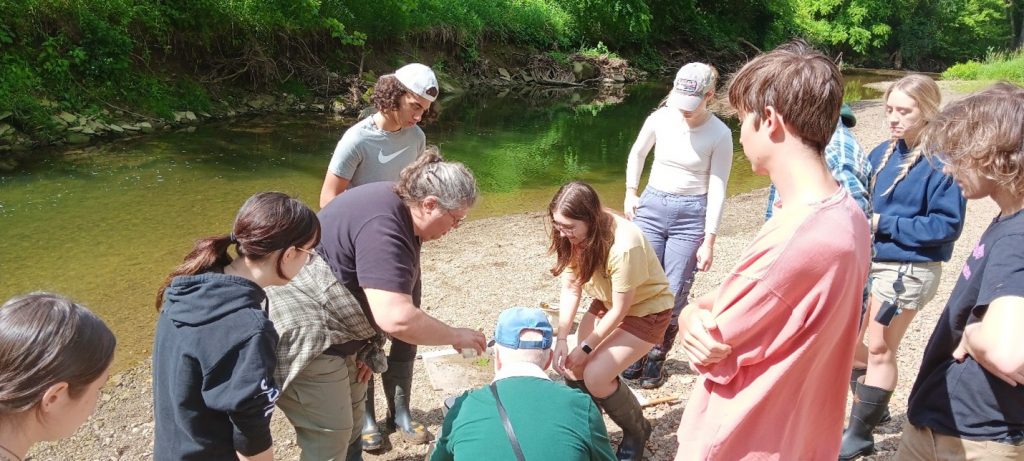
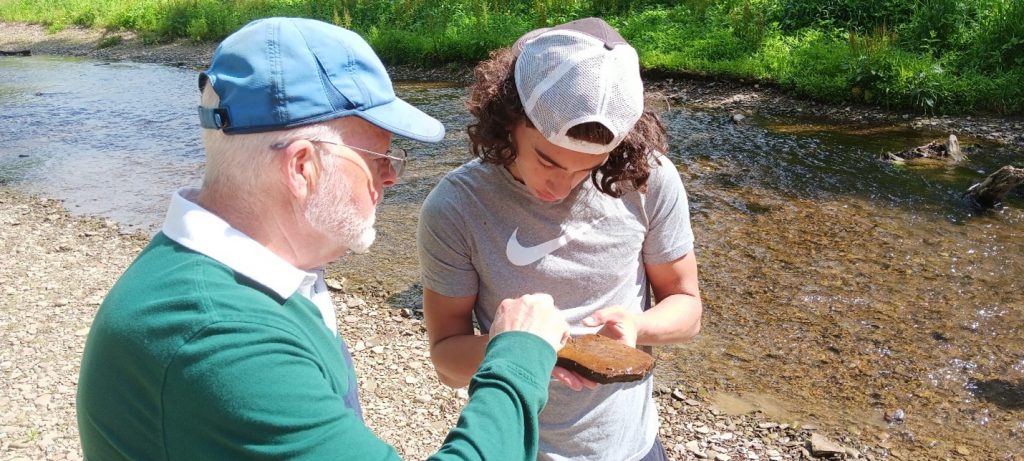
Carrie taught us about the types of organisms we found.

Final tray for site one
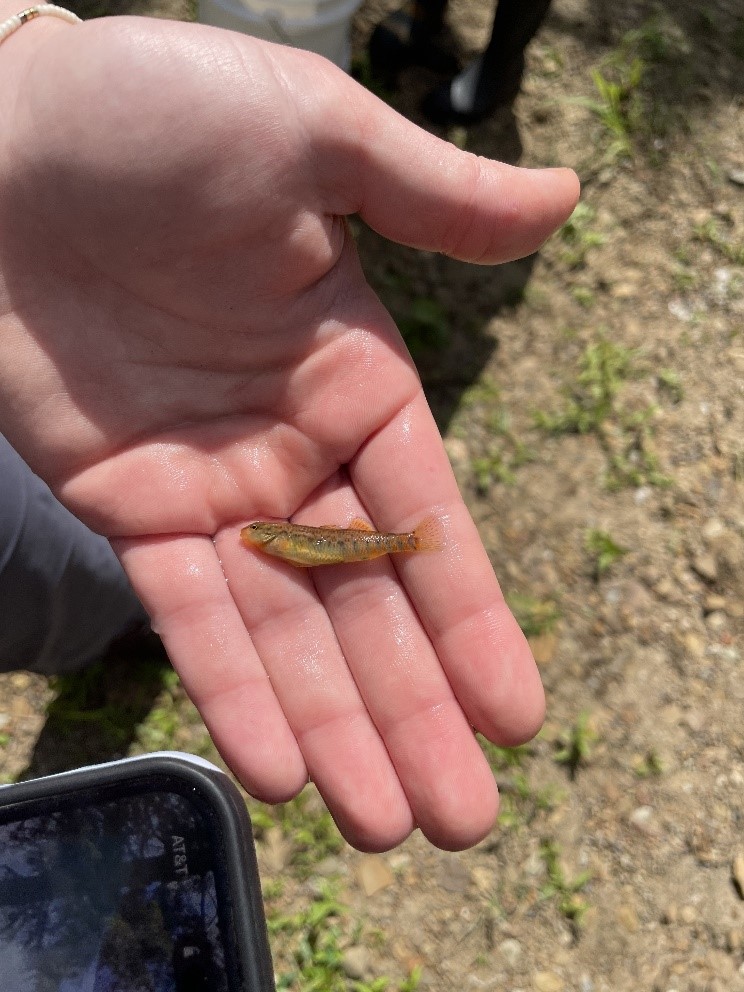
Rainbow Darter (Etheostoma caeruleum)
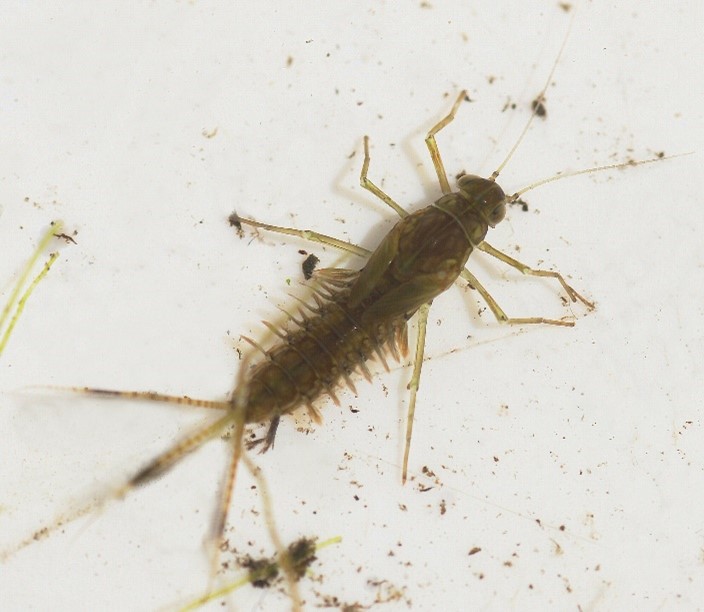
Mayfly Nymph
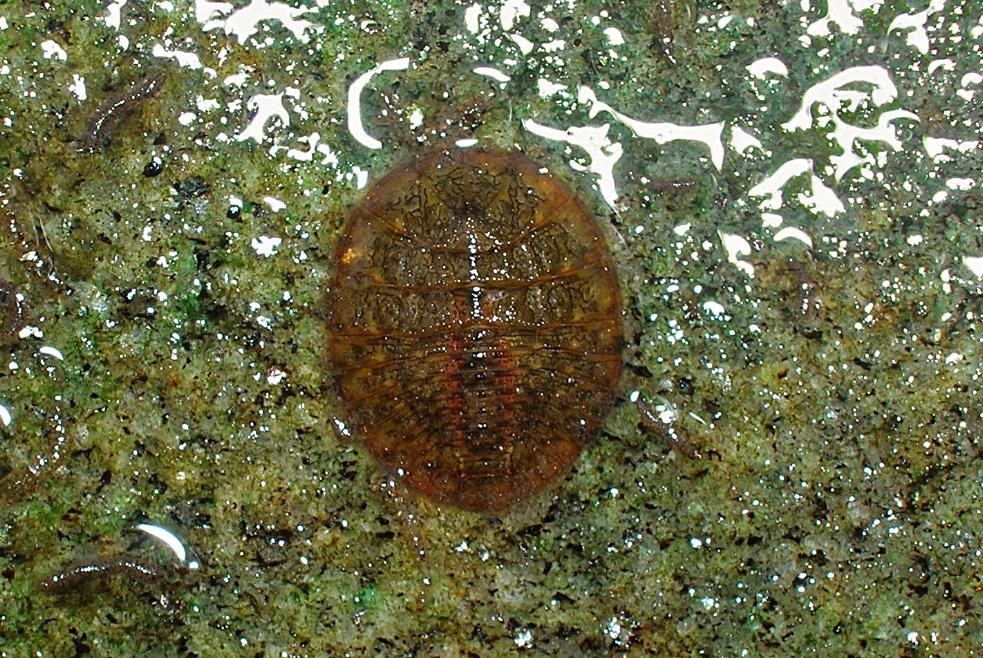
Water Penny (Psephenidae sp.)
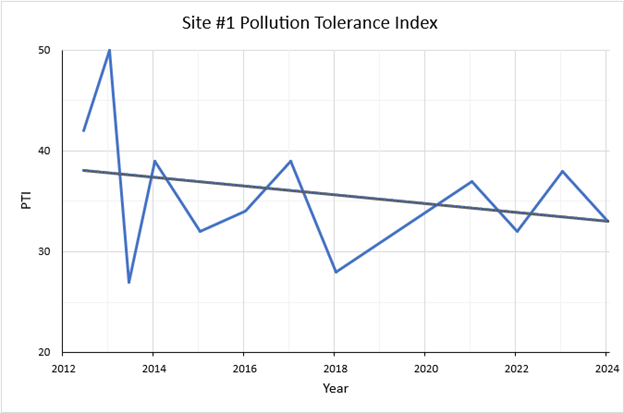
Site 1 Pollution Tolerance Index by year for the past 12 years. The lowest rating was 27, meaning PTI was excellent for every year measured.
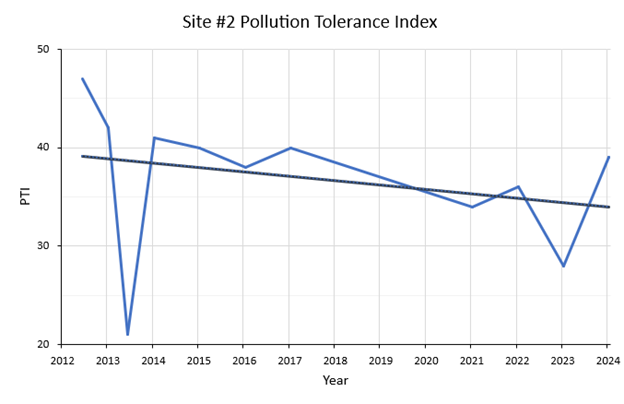
Site 2 Pollution Tolerance Index by year for the past 12 years. The lowest value recorded, November 2013, had a value of 21, indicating good water quality. Other than that, the stream recorded excellent or better water quality throughout the recorded measurements.
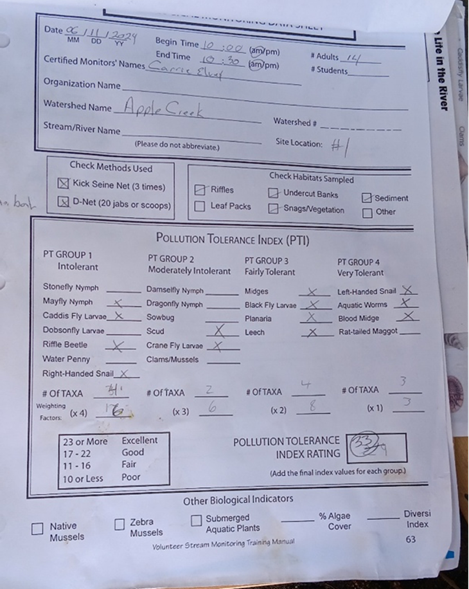
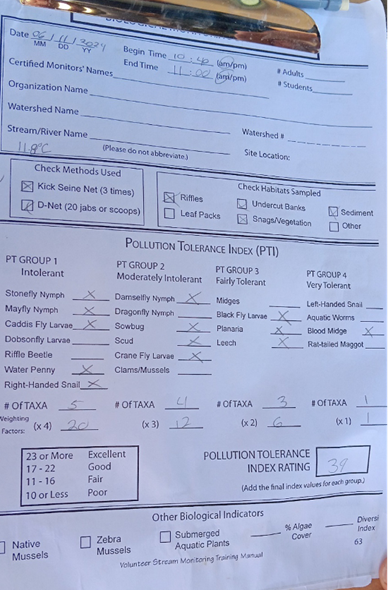
Original data sheets were collected for sites 1 (left) and 2 (right).
The stream continues to receive a ranking of excellent – the highest possible rating. This excellent stream health rating for Apple Creek indicates a bright future for the stream.
In addition to the macroinvertebrate survey and our calculated pollution tolerance index, we compiled data from data loggers installed in the stream.
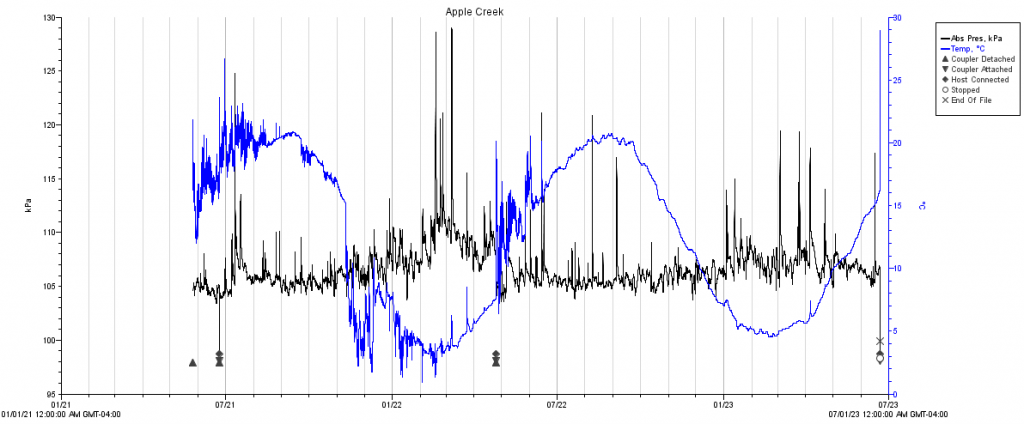
Apple Creek graph showing temperature in blue (ºC) and water levels in black (kPa) measured from a data logger in the stream channel itself. As expected, temperatures fluctuate by season, while water levels change over a shorter time frame. Note that storm events (peaks in water levels) are associated with warmer temperatures in the warm summer months and colder temperatures in the winter/early spring. These data were taken every hour.
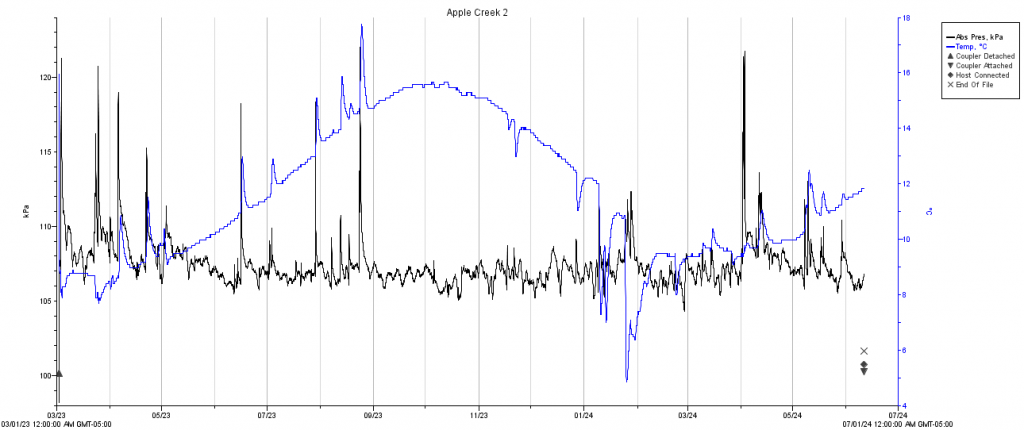
Apple Creek 2 showing the temperature in blue (ºC) and water levels (kPa) when a new logger was implemented into a well casing that was installed into the stream bank approximately 10 feet from the channel and about 5 feet deep. In the coming years keeping track of the physical aspects of water flow and temperature should add to the story of environmental and water quality of Apple Creek monitoring efforts by Trout Unlimited, CFAES, and The College of Wooster.
Nice work, Summer Team. Love the combination of cool critters and useful environmental data. Note how much a water penny looks like a trilobite!