 Editor’s Note: Independent Study (IS) at The College of Wooster is a three-course series required of every student before graduation. Earth Sciences students typically begin in the second semester of their junior years with project identification, literature review, and a thesis essentially setting out the hypotheses and parameters of the work. Most students do fieldwork or lab work to collect data, and then spend their senior years finishing extensive Senior I.S. theses. This year we again had the COVID-19 pandemic to deal with, so our students have had few chances to publicly present their hard work and scientific ideas. Some, then, will be writing blog posts like this. The text and images here are from Will Santella (’21), who is a member of Team Utah 2020. The picture above shows an outcrop of the Lower Co-op Creek Limestone Member of the Carmel Formation at the Gunlock Reservoir, Gunlock, Utah. Now Will takes over —
The Lower Co-op Creek Limestone Member of the Carmel Formation (pictured above) is a sedimentary unit that formed at the southernmost tip of the epicontinental Sundance Seaway during the Bajocian stage of the Jurassic period. This thesis regards a small portion of the Lower Co-op Creek Limestone Member, located near the town of Gunlock, Utah. Among the plethora of invertebrate fossils lying in this unit are microbialites; ancient fossilized photosynthetic cyanobacterial mats which grew in the shallow-marine tidal zones characteristic of the Lower Co-op Creek Limestone Member.
These “microbialites” are classified in two groups; the laminated “stromatolite”, and the clotted “thrombolite”. The purpose of my thesis was to describe these extraordinary lifeforms by analyzing patterns in stromatolite laminae, and identifying unique thrombolite morphology.

Laterally-linked hemispheroid stromatolites at the Gunlock Reservoir locality.
Stromatolites are laminated benthic microbial deposits first identified by Ernst Kalkowsky in 1908. Formed by the lithification of sediment by photosynthetic cyanobacteria, stromatolites exhibit a variety of morphologies; those in the Carmel Formation are composed of finely layered continuous laminae. In an ideal environment, a stromatolite lamina is a perfect record of the sedimentary, biological, and atmospheric conditions at the time of lamination. I applied principals of cyclical harmonic analysis to laminae data in an attempt to map chronological changes in the morphology, composition, and habit of stromatolite laminae in the Lower Co-op Creek Limestone Member. This analysis was conducted by using a harmonic wavelength generator in RStudio to create models of cyclical changes in the recorded attributes of stromatolite laminae; the results of which were remarkable.

Laterally-linked hemispheroid stromatolite laminae under a petrographic microscope.
 Chart describing trends in stromatolite lamination via a harmonic model (blue) and a linear regression model (red).
While I determined that there was no statistically significant change in stromatolite laminae over time, the morphology, composition, and habit of a stromatolite lamina was the direct result of the tidal stage under which it formed. “High tide laminae” were thicker, exhibited large diagenetic dolomite crystals, and contained a greater abundance of large quartz grains than their related “low tide laminae”, which were thin, and primarily composed of micritic sediment. This previously undescribed relationship between tidal stage and stromatolite lamination is key to understanding the growth patterns of these phenomenal organisms.
 Thrombolite hand sample displaying unique clotted morphology.
Thrombolites are defined as cryptalgal structures related to stromatolites but lacking lamination and characterized by a macroscopic clotted fabric (Aitken, 1967). The term “macroscopic clotted fabric” refers to the matrix of internal mesoscopic structures that are composed of individual, distinct microbial colonies. These mesoscopic structures can be anywhere from less than a millimeter to several centimeters wide, and are separated by a dividing matrix of sediment, biological debris, or sparry carbonate (Kennard and James, 1986).
The thrombolites of the Lower Co-op Creek Limestone Member are unique- specifically, the small, lightly clotted morphology of these organisms is not described in literature regarding Bajocian paleontology. Additionally, thrombolite structures from the Carmel Formation do not match any of the widely used thrombolite morphology classifications described by Theisen and Sumner (2016). These thrombolites exhibit a light clotted fabric divided by dark, fine grained sediments, and do not display layered microbial matrix features within clots, as is characteristic of many thrombolite classifications.
I ultimately determined that while the thrombolites of the Lower Co-op Creek Limestone Member were morphologically unique, their formational environment was consistent with the shallow marine, slightly turbulent thrombolite reef facies similar to that of their predecessors.
There are many aspects of the Independent Study process which I enjoyed- field work amidst the stunning Utah desert, 50-hour weeks in the quiet isolation of our Scovel Hall paleontology lab, and rigorous scientific study. Beyond all of that, I spent my days working with the fossilized remains of organisms I have been fascinated with for years- holding a deep and almost spiritual respect for the lifeforms that many regard as evidence of the first life on Earth. I owe a great deal of thanks to the Earth Science Department- especially Patrice Reeder for her part in organizing Team Utah 2020, and Dr. Judge for sparking my interest in stromatolites, mentoring me through my degree, and providing superior camaraderie. I thank my superlative advisor, Dr. Wilson, for aiding me over my years at the college both as a professor and as a friend, and for making my passion project a reality.
References:
Aitken, J.D., 1967, Classification and environmental significance of cryptalgal limestones and dolomites, with illustrations from the Cambrian and Ordovician of southwestern Alberta: Journal of Sedimentary Petrology, v. 37, p. 1163-1178.
Kalkowsky, E., 1908, Oolith und stromatolith im norddeutschen Buntsandstein: Zeitschrift der Deutschen Geologischen Gesellschaft, v. 60, p. 68-125.
Kennard, J.M., and James, N.P., 1986, Thrombolites and stromatolites: two distinct types of microbial structures: Palaios, v. 1, p. 492-503.
Theisen, C.H., and Sumner, D.Y., 2016, Thrombolite fabrics and origins: Influences of diverse microbial and metazoan processes on Cambrian thrombolite variability in the Great Basin, California and Nevada: Sedimentology, v. 63, p. 2217-2252.


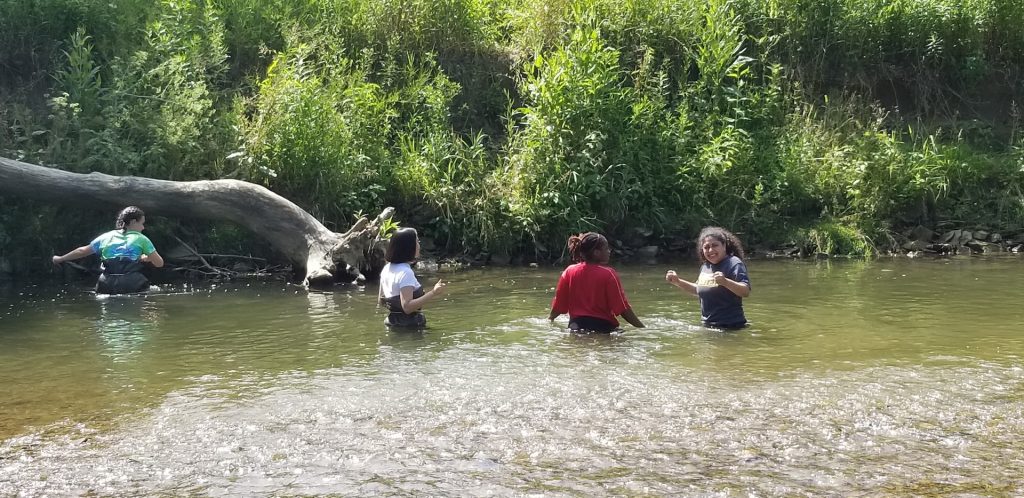
 Grace Hodges before she goes in to use the dip net method to collect macroinvertebrates.


 – The END. We hope you enjoyed our content.


 Nathan Kreuter cores one of the oldest oaks as part of his tutorial at the Wooster Tree Ring Lab.
 Tree ring widths are most sensitive to April-August total precipitation. The correlation between the ring-widths and precipitation changes over time with the strongest relationship r = 0.6 for the interval 1945-1975. After 1975 the correlation falls off possibly due to the increase in precipitation and loss of sensitivity at the site with the abundant moisture.