Editor’s note: The following is by Caitlyn Denes (’23).
“The Community Climate Change Project sought to document the changes in climate in Wooster, Ohio and surrounding communities. Through the collection, analysis, and interpretation of climatological data, we summarized our findings and developed recommendations to improve the resiliency of the community in the face of climate change. Having served a wide variety of local clients, we are hopeful that our findings will educate community members and foster strong connections with community partners.”
When a group of rising sophomores entered Scovel 116 on May 16th, I do not think they realized how much they would grow as students, researchers, and as people. Tasked with researching the dynamic interactions between climate variability and the local community, the CCC Team had their work cut out for them from the beginning of their AMRE project. As a peer advisor to the work that was completed, I watched our group come together to form an effective, successful, dynamic research team in just six weeks. Supervised by Dr. Pollock and Dr. Wiles, our team encountered some great experiences. It is impossible to cram six weeks of research and field experience into just one post, so here are just some of the highlights!
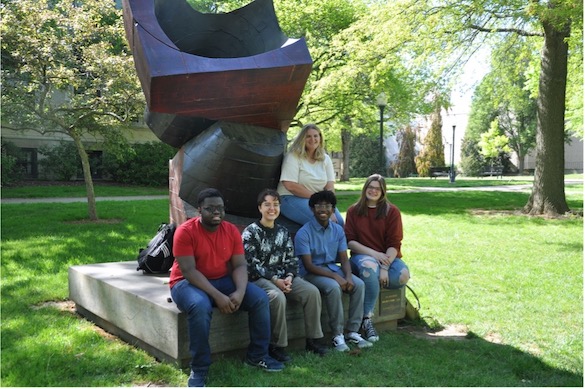 From left to right: Front- Kelvin Ansah, Skylar Barnett, Tyrell Cooper, and Desiree Smith; Back-Caitlyn Denes.
Week One- Introduction to AMRE
This group deserves a shout-out for maintaining a great work ethic for the entire first week! The first week of AMRE is usually an adjustment period, as 40-hour workweeks can be a bit draining. Despite the lingering end-of-semester fatigue and introductory AMRE events, the group made great progress. To prepare for an upcoming tree-core gathering trip to Secrest Arboretum, Dr. Wiles demonstrated the tree coring process on trees just outside the doors of Scovel. For two group members, this was the first time they had ever cored a tree, so we made sure to document the momentous occasion! We then took the samples to the basement to practice mounting and sanding the cores—a skill that would come in handy later on!
 Skylar records the conditions in a field notebook as the others prepare to core.
Having covered the basics of tree coring on campus, the group set off for Secrest Arboretum (SA) the following afternoon. The goal of the trip was to collect tree cores from a plot of White Oak trees. Native to Northeast Ohio, White Oaks are considered a keystone species, recognized for their role in supporting the ecosystem. Additionally, they put on a reliable annual ring, making them excellent indicators of climatic change over time, specifically regarding precipitation and temperature changes. Joined by tree coring experts Fred Zhao and Jerry Fu, a total of 20 cores were taken from the White Oak plot, allowing the team to develop a chronology that could then be correlated with local climatological changes. The group also collected soil cores that were sent off to the OARDC for analysis to determine their carbon sequestration potential.
 Despite the thick vines of poison ivy surrounding the trees, Skylar and Desiree plot the coordinates of a White Oak in their field notebooks as Tyrell begins coring.
 Kelvin and Jerry hard at work plotting the tree’s location
Week Two- Rings, Rings, and More Rings!
With the SA White Oak cores back in Scovel, carefully mounted and sanded, the hard work could begin. Supervised by Dr. Wiles, Fred, and Jerry, the team got to work cross dating the samples in the Tree Ring Lab. While learning to use the measuring software was tricky at times, the team successfully created a chronology from the SA cores.
 Kelvin and Tyrell pondering over significant correlations between tree cores
To take a break from all of the ring counting, measuring, and analyzing, the group was joined by the rest of Scovel’s summer student employees for a Wilderness First Aid training course. After this course, we learned basic first aid techniques and strategies to provide aid in the case of a medical emergency in the field.
 As Dr. Pollock’s Instagram post illustrates, we were prepared to handle any emergency in the field, such as venomous snake bites, broken legs, and CPR
With a tree ring chronology successfully created, the team had a great figure to include in their first internal presentation. Joined by several other AMRE groups, the team presented their initial findings and goals moving forward. After the success of the morning’s presentation, Dr. Wiles led the group on a field trip to the L.C. Boles Golf Course to look at ancient soils and collect cores for analysis at the OARDC.
Despite the cloudy skies, the group set off, only to quickly become victims of a total downpour. Sheltered by the trees, Dr. Wiles, Fred, and Tyrell worked to dig a pit, exposing the parent material. In the meantime, Desiree, Skylar, Kelvin, and Jerry took a collection of soil core samples that would also be sent to the OARDC for analysis. After a check of the radar, it looked like the rain was not letting up, so we left the site.
 Tyrell and I documenting a very soggy field trip to the golf course!
Week 3- Fieldtrips, Climatological Analyses and More Fun!
After collecting soil samples at two different plots, the team started the week with a trip to the STAR Lab at the OARDC. Lab manager Sunny Park led us on a tour, showing us the equipment used to test water, soil, and other types of samples. It was very cool to see the machines that would be testing the soil samples that we collected, and the students asked very insightful questions about laboratory operations.
 With a tree ring chronology created, the group received a crash-course in KNMI Climate Explorer, a software used to correlate climatological variables. The group was able to correlate their white oak chronology with local precipitation and temperature records, which yielded promising results. With help from Dr. Wiles and myself, the group was able to interpret what the climate variability in Wooster was doing to the white oak species. After this, the group developed graphics that would then be used in their AMRE presentation at the end of the week.
To learn more about white oaks in the urban setting, the group was prepared to take a mid-week trip to Cleveland. Unfortunately, the trip was cancelled at the last minute, so we decided to visit a few local sites to make the most of the day. Our first stop was the spring house at Kinney Fields, where Dr. Wiles educated us about the complexities of groundwater and how it is impacted by human activity. After gathering a water sample for isotopic analysis, we discussed debris flows and how they shaped the landscape near the spring house. With our newfound knowledge, we traveled to Grosjean Park to learn about stream gauging. Under Nick’s instruction, the group practiced using instruments that measured flow velocity and depth across a section of the Apple Creek. The group finished out the week by working with Climate Explorer and started drafting a report about the climate response of the Secrest white oaks. After another excellent AMRE internal presentation, we could see how far this group of students had come in just three short weeks!
 The group observes the aftermath of Desiree sinking in some debris-flow mud near the spring house.
 Tyrell, Skylar, and Desiree watch as Nick instructs on how to measure flow velocity.
Week 4- Trout Unlimited Stream Survey, Report Writing, and Tionesta Preparations
After Friday’s jaunt to Apple Creek, the group found themselves back at Grosjean Park. This time, they joined representatives of Trout Unlimited to conduct a macroinvertebrate survey. The goal of the survey was to determine the overall health of the stream, which was also completed by last year’s AMRE group. After spending the morning working with the folks from Trout Unlimited, the group had a good understanding of stream monitoring and the role in plays in the preservation of bodies of water like Apple Creek.
 The AMRE group, joined by Fred and Jerry for the day, take part in the stream survey.
 With the help of Trout Unlimited and its volunteers, a successful stream survey took place. Based on the macroinvertebrates found on this day, the stream health was determined to be “excellent.”
After Monday’s trip to Apple Creek, the group continued to make progress on a report detailing the climate response of white oaks in Secrest Arboretum. For some students, this was their first time writing a technical report, so we were sure to provide lots of feedback and suggestions during the drafting process. In doing so, the group developed a template that could be used when examining white oaks elsewhere. This was of great help later on, as they looked at the climatic response of two other white oak plots—Wooster Memorial Park and Johnson Woods. With the tree ring chronologies already developed for these two locations, reports could be written without even traveling to the sites. The group’s efficiency was impressive to see as they drafted these reports with ease. At the same time, preparations for an upcoming camping trip to Tionesta, Pennsylvania were well underway.
By end of the week, the group was eager to leave for their Sunday-Monday overnight trip to Tionesta. After gathering enough gear and supplies for the excursion, excitement was high.
 After making sure all the tents were in working condition, Tyrell decided to do some quality control (or was it napping on the job?)
As the resident Pennsylvanian of the group, I created a PowerPoint presentation to inform the group about the wonderful things the Keystone State has to offer. Topics included: state geography, flora and fauna, notable natural and man-made disasters, famous Pennsylvanians, culinary delicacies, and more! With a 7:30 AM departure planned for Sunday morning, the group was eager to set off on a great adventure.
Week 5- Tionesta, Client Meeting, Report Writing, and More!
Unfortunately, I was unable to join the group on the Trip to Tionesta. That being said, it is only right to include the thoughts of the students regarding their experiences with some of the greatest minds in the field of dendrochronology, including none other than Mr. Ed Cook.
Here is what the students had to say:
Desiree Smith: “The trip to Tionesta was a really great experience for me. With interest in going into this field later in life, it was great to be able to talk to and work with professionals in the field (outside of my own organization). I also loved having the opportunity to interact with my team in a more casual sense, having fun and going on little adventures together around the campsite was great and made for lots of great laughs. I learned a lot while we were out there and if I had the chance, I’d definitely go back again!”
Tyrell Cooper: “Our trip to the Allegheny National Forest was very successful in meeting professionals and working with them in the field. I was able to get a sneak peek into my future career with this opportunity and I am glad to say that I am ready for what’s to come.”
Kelvin Ansah: “On the second day of our trip, we journeyed from the campgrounds to The Allegheny National Forest to core trees at a particular site. As we walked into the forest, we witnessed many fallen trees and large swampy patches of land. We separated into two groups to core White Oak trees and Cherry trees before meeting up at our starting point.”
Skylar Barnett: “Though I am not planning on pursuing a career in Earth Sciences, this trip provided a unique opportunity to interact with pioneers in the field which was eye-opening and enjoyable. It was inspiring to see how passionate everyone was about caring for the environment, and lovely to experience the eagerness of everyone to learn about each other’s research, from the undergraduates to industry professional.”
 Kelvin and Tyrell take in the sights of the reservoir near the campsite.
 Desiree, Dr. Wiles, Fred, and Laura (a PhD candidate from Harvard Forest) take in the sights of the forest.
 Wooster Earth Sciences takes on Allegheny National Forest!
After returning from the Tionesta trip, the group got back to work on their white oak reports. Looking at the results of three different white oak analyses, it was clear that each site was positively correlated with the increasing precipitation and negatively correlated with the rising temperatures observed in Wooster. With these promising results, it was decided that that the group’s findings needed to be shared with the science community. The group spent the remainder of the week drafting an abstract to be submitted to the American Geophysical Union’s 2022 Fall Meeting.
Midweek, we met with Tate Emerson, the executive director of the Killbuck Watershed Land Trust. It was a great opportunity for the students to develop their professional skills and expand their networks. Our conversation was useful in many respects, but most importantly, it established the need for updated, easy-to-understand information about climate change in the Wooster area. Tate though that being able to hand a brochure to landowners about the downfalls of climate change would be a useful outreach tool. After this meeting, it was decided that a “Climate Change in Wayne County, Ohio” brochure would be added to the list of project deliverables.
As the project was winding down and two new deliverable ideas were introduced, there was a lot of uncertainty looming in Scovel 116. Was it possible to accomplish all that they wanted to do? Could they realistically turn out an abstract and brochure in addition to the required AMRE deliverables in the time remaining? At this point, I observed some of the best collaboration among the team. Having realized that active collaboration and assignment of tasks was a necessary step in completing the to-do list, the students quickly organized themselves into teams. Skylar and Desiree took charge of drafting/editing the abstract and working on some of the AMRE deliverables, whereas Tyrell and Kelvin oversaw the development of the brochure. Once the workload was divided, it did not seem as daunting, and the groups started work in their respective areas. With constant feedback from Dr. Pollock, Dr. Wiles, and myself, great progress was being made. By the end of the week, it was clear that the students had adapted to the change in the workload and were on track to finish all deliverables by June 24th.
Week 6- The End is Near!
At our daily check-in on Monday, it was hard to believe six weeks had passed since the beginning of the project. After a brief review of the week’s goals, the students set off to accomplish their remaining tasks. They approached these tasks with such enthusiasm and illustrated the productivity that can only be created by group collaboration. As our time together wound down, we took time to reflect on our experiences over the project. Despite data collection, analysis, and interpretation being pillars of the program, it was equally important to consider the personal and professional development that our AMRE Associates experienced. We talked about updating our résumés to reflect this growth, as well as how to describe this project to potential employers. To finish out the week, the team delivered their final presentation to the other AMRE groups and worked on their abstract/the submission process and their poster.
As we spent one final lunch hour together (with some yummy food from Spoon Market), it was great to reflect on the experiences we shared as a team. It was bittersweet to say goodbye, but I am sure that this was a memorable experience for all our group members.
As for me, I am grateful to Dr. Pollock and Dr. Wiles for the opportunity to be a peer advisor to this project. I enjoyed my time working with these students, helping them grow not only as geoscientists, but also as researchers and aspiring professionals. This AMRE team made amazing progress and I can’t wait to see what lies ahead for them all!


 Another sea star with tenticles flaring.


 Lilly took a great picture of the dock on Auke Lake just down from our lodging at the University of Alaska Southeast campus. We spend two nights in Juneau getting staged for our trip south.


 …
… 


