The semester is winding down, so we only have a few more of these climate visualization posts to go. Today, I want to highlight repeat photography. Taking a picture of the same place several or many years apart can be a striking demonstration of change and capture the imagination better than a sterile graph or abstract map.
The flashiest examples applying the idea to climate change come from productions like Chasing Ice by the Extreme Ice Survey or Chasing Coral by Exposure Labs. (Chasing Coral was recently featured here at the College of Wooster as part of the “Great Decisions” series.) The products can be truly fascinating, especially when many photographs are combined in a time lapse video. For example, the video of the Extreme Ice Survey’s repeat photography of Mendenhall Glacier, embedded below, gives a better impression of glaciers as flowing masses of ice than any single photograph or model simulation. It also shows the decline in mass at the toe of the glacier between May 2007 and August 2011.
Rules of Climate Change Repeat Photography
Showing climate change with repeat photography requires a few special considerations:
First, you need to have not only the same location, but the same angle for your shot, showing the same context around the feature of interest in each and every photograph being compared. This is why the Extreme Ice Survey set automated stations with the cameras well-mounted rather than using hand-held cameras. Much of the Chasing Ice documentary is about building and installing the equipment necessary to achieve this fundamental “rule” of repeat photography. The Chasing Coral team tried similar techniques, only with the added complication of being under water. Needless to say, it was harder for the Chasing Coral team.
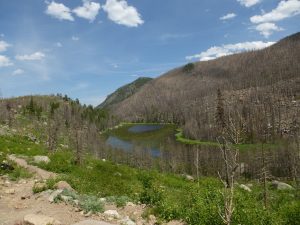
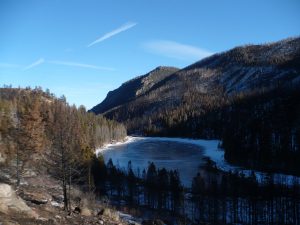
Second, any repeat photography of environmental phenomena had better avoid making natural seasonal cycles look like climate change. The two pictures of Sub Lake in Rocky Mountain National Park above were taken in June 2015 and January 2013. The difference between the two isn’t climate change; it’s winter. Another example: The Mendenhall Glacier video shown above is labeled as “May 2007 to August 2011”. A red outline of the glacier in the first frame is compared to the outline of the glacier in the final frame, and that’s a little deceptive. Just like snow cover and sea ice, the Menhendall Glacier has a greater extent and thickness at the end of winter than the end of summer — especially at the toe. So part of that difference you’re seeing is just the fact that a) over 80 inches of snow typically fall on the toe of the Mendenhall from October to March and b) the average high temperature is over 60°F in June, July and August in southeast Alaska. It’s likely to look more robust in May than August, so the time lapse would be better starting and ending in the same month.

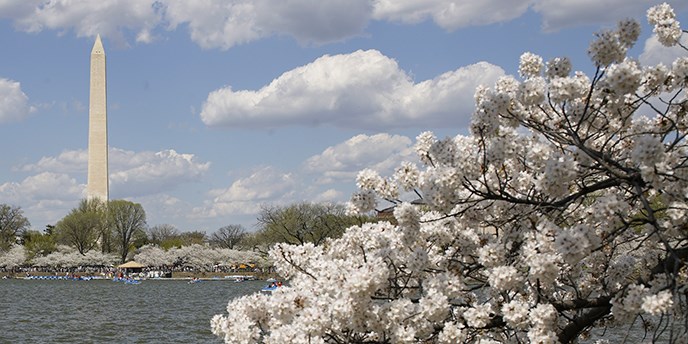
Cherry blossoms in Washington, D.C. (from the National Park Service)
Third, climate change is not the only factor that determines whether one year is cooler or warmer or wetter or drier than the last. Climate change is not the only factor that determines whether coral bleaching will occur or whether a glacier will retreat. For example, in Chasing Coral, a coral bleaching event in Australia is highlighted and attributed to climate change. At the same time, though, an El Niño event was occurring. El Niño is a natural part of the climate system, but it can also lead to warming and coral bleaching. Was global warming a factor in this bleaching event? Absolutely, but the devastation depicted in Chasing Coral may have been less overwhelming in a La Niña or normal year. As another example, if you were trying to take pictures in Washington DC to show how the date of cherry trees blooming was coming earlier each year, you might be disappointed. Although blooming is now occurring on average about a week earlier than in the 1970s, peak bloom was actually slightly later than average this year. The best way to get around this issue is to have several decades between the start and end of the repeat photography pair or sequence.
The Repeat Photography Project at Glacier National Park
With all these rules in mind, the United States Geological Survey (USGS) is currently undertaking a repeat photography project for the failing glaciers of Glacier National Park. They’re also soliciting help from visitors in a crowd-sourcing effort. The time spans exceed 50 or even 100 years for these photos, which is enough time to see some truly remarkable changes to Glacier National Park’s namesakes. It’s even long enough to avoid the seasonal issues discussed above. As an example of the output, below is repeat photography of Boulder Glacier (1932 to 2005) from the Northern Rocky Mountain Science Center (NOROCK).


Note the USGS did this with a survey in 1969 to reoccupy photo positions taken by the Powell expedition down the Green and Colorado river in 1869/1872. Another set apparently exists based on 1890 photos made during the survey of the unbuilt Denver Colorado Canyons and Pacific Railroad in 1890 and re-occupations in 1990. (The idea was that rivers provide the flattest route to the sea, so building a railroad from Grand Junction Co to the Gulf of California was the way to go thru the canyons of the Colorado, a case of a good premise being wrongly applied, but the engineer was killed on the river and construction was never started)
I suspect that with some effort to find and re-occupy locations we could get 120-130 year time frames, possibly longer going to perhaps 150 years.
David Breashears, the mountaineer, did a nice photo journey in the Himalaya, archived at the following link, at Yale. His photos reproduced images/perspectives from mountaineering expeditions early in the 20th century:
https://e360.yale.edu/features/tracking-the-himalaya-rsquo-s-melting-glaciers
Bruce Molnia, from the USGS, with Jim Pfeiffenberger, created a beautiful PPT presentation, with slow dissolves between images, of retreating glaciers in Alaska. I can never find this in the USGS archives (their search engine leaves something to be desired…), but I have a copy warehoused on my Drobox.com account. I use this PPT quite a lot, because it’s so persuasive. Here’s a link:
https://www.dropbox.com/s/d76cicycuqxs77m/glacier_dissolves3.ppt?dl=0
Good stuff!
I’ve seen that shot of David Breashears holding up the old photo before — classic. But I had never seen that 360 shot before, nor all those pictures from Kenai Fjords. Thanks for sharing, Bill!
And thanks for also sharing, Lyle. Although I’m not sure how dramatic the change would be, I imagine some changes from the Glen Canyon Dam would show downstream in the Colorado. 150 years is about as good as can be hoped for with photographs! Really cool!